
Stop maintaining the spreadsheet.
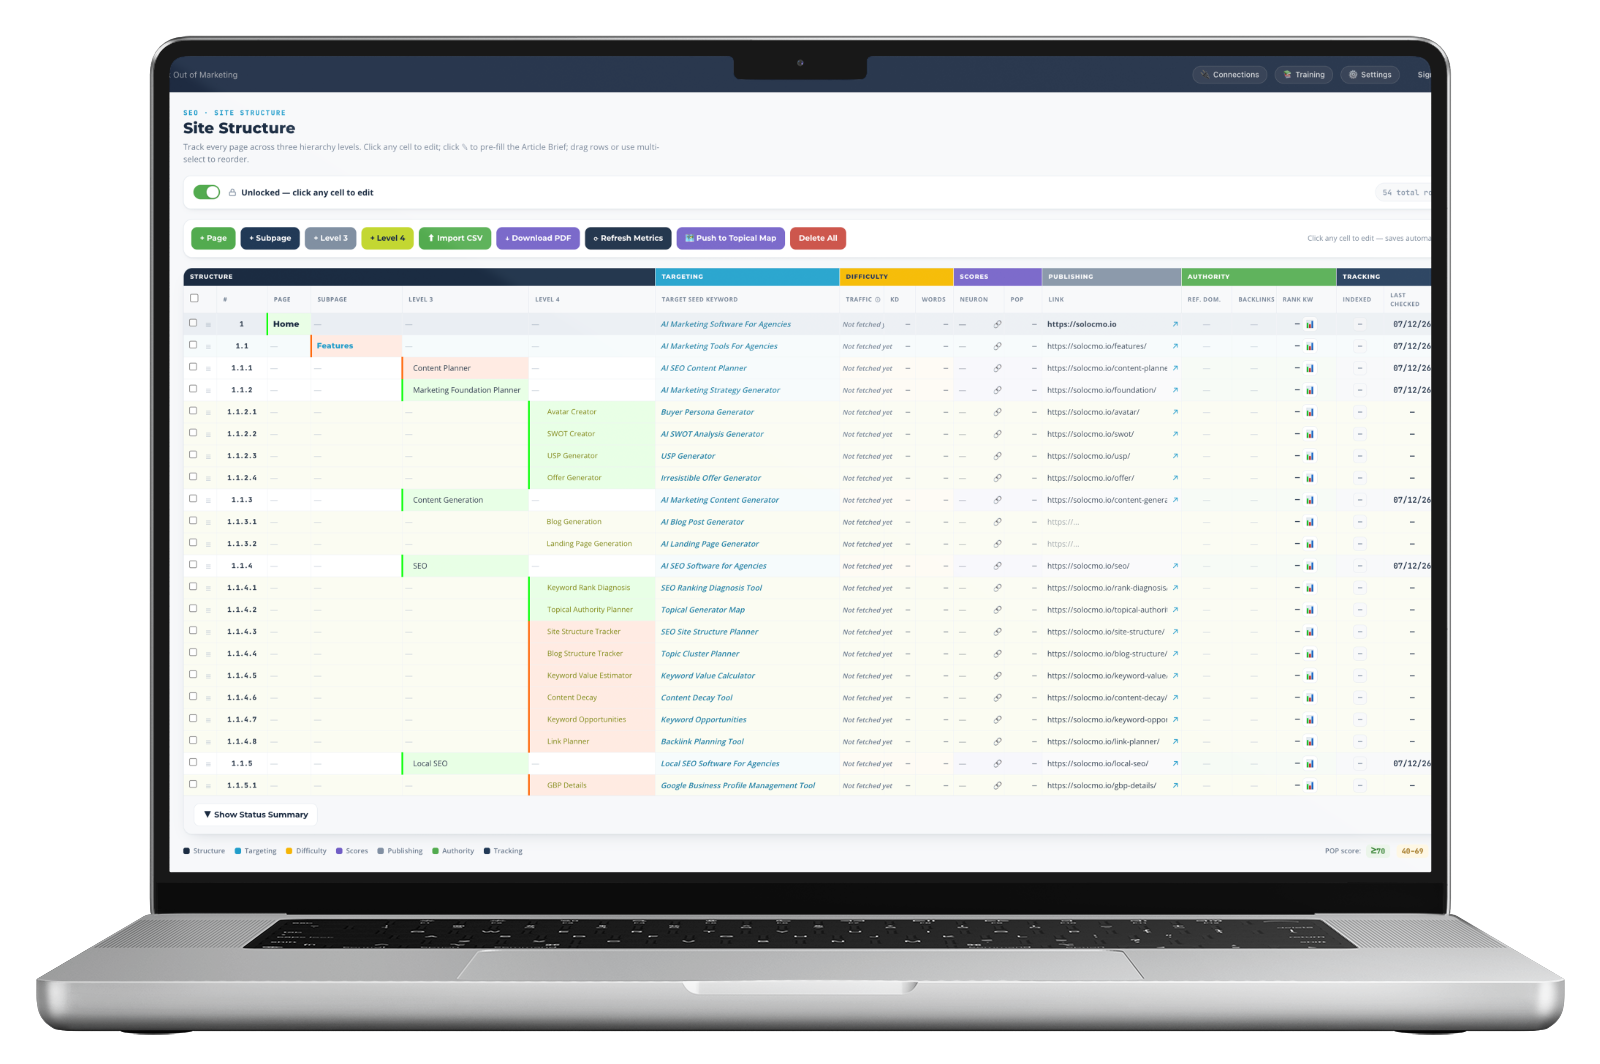
One row per page, and in that row: the keyword it targets, how hard it is, how the live page scores, the URL it sits at, the links pointing to it, whether it's indexed, and what stage it's at.
The same plan as the topical map, in the form you actually work in.
Every agency keeps this spreadsheet. Nobody keeps it current.
Tab per client. Columns for the page, the target keyword, the difficulty, the word count, the optimizer score, the URL, whether it's live yet. Built with good intentions in month one.
Then it goes stale, because every one of those numbers lives in a different tool and getting them into the sheet means opening five tabs and pasting. At fifteen clients, updating it is a day's work, so it becomes a record of what you planned in January rather than what's true today — and eventually you stop opening it.
Everything about a page, on the same line.
The columns are grouped by the question they answer — where it sits, what it targets, how hard it is, how it scores, where it lives, what points at it, and where it stands. Scroll right and the story of a single page continues without ever leaving its row.
Structure
- Page
- Subpage
- Level 3
- Level 4
Targeting
- Target seed keyword
Difficulty
- Traffic
- KD
- Words
Scores
- Neuron
- POP
Publishing
- Live link
Authority
- Ref. domains
- Backlinks
- Ranking kw
Tracking
- Indexed
- Last checked
- Status
POP scores band at 70 and above, 40 to 69, and below 40 — so a weak page is visible without reading the number.
The numbers are fetched, and dated.
Traffic and difficulty against the seed keyword. Word count and optimizer scores against the page as it actually stands. Referring domains, backlinks and ranking keywords for authority. Indexation, with a last-checked date beside it.
That date matters more than it looks. A spreadsheet never tells you how old its numbers are, so you trust all of it equally and shouldn't. Here you can see which rows are fresh.
- Seed keyword traffic and difficulty, pulled rather than pasted
- Live word count and both optimizer scores against the published page
- Referring domains, backlinks and ranking keyword count per URL
- Indexation status with the date it was last verified
- Locked by default, so the plan of record doesn't change by accident

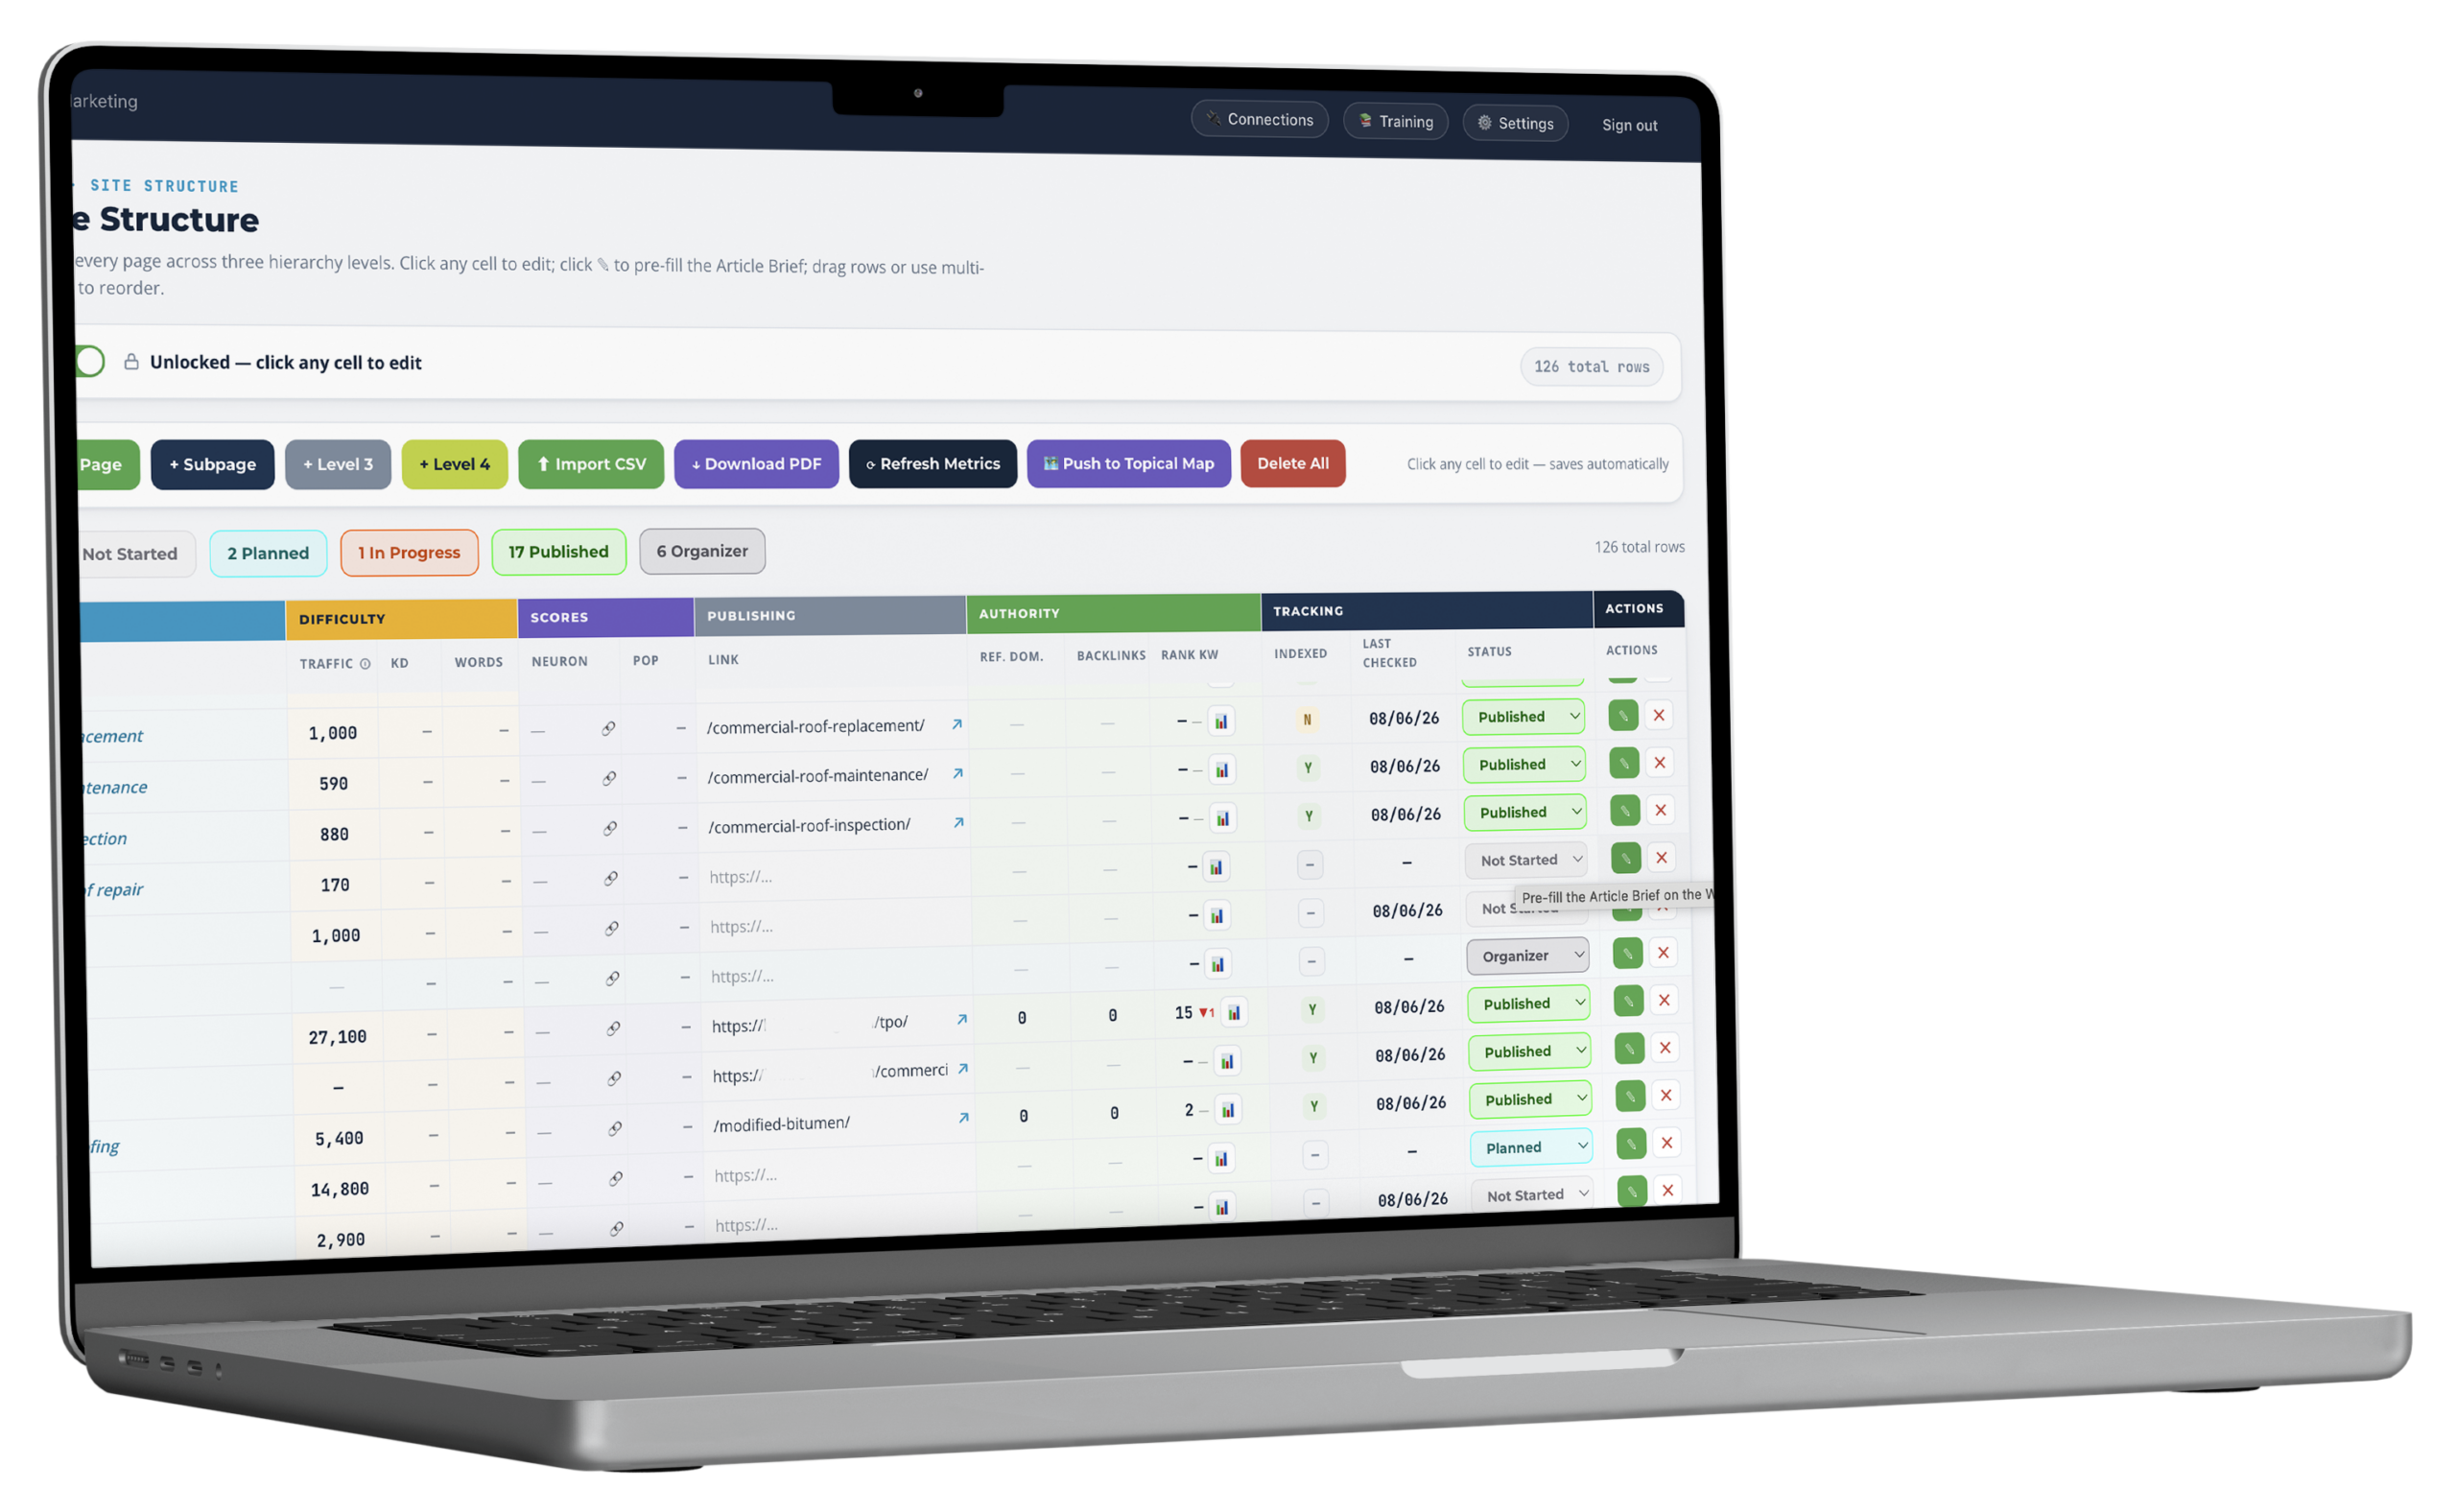
Four stages, counted at the top.
Every row carries a status, and the counts sit above the table. It's the answer to the question a client asks on every call — how much of the plan is actually done — without anyone building a report to find out.
47
Not started
Planned in the structure, no work begun. The size of the runway.
0
Planned
Scheduled and briefed, waiting its turn in the queue.
0
In progress
Currently moving through the writing pipeline.
0
Published
Live, with a URL and its own performance numbers filling in.
A real client at the start of an engagement. Forty-seven pages planned, none built yet.
A row becomes a brief in one click.
Everything the article pipeline needs is already sitting in the row — the target keyword, the position in the hierarchy, the URL it will live at, the parent service it supports. One action pre-fills the brief with all of it and hands the page to the writer.
Which is the whole point of keeping the plan in a table rather than a document. The plan and the work are the same object.
- The article brief pre-filled from the row's own fields
- Status moves through the four stages as the page progresses
- Drag rows or multi-select to restructure a silo without rebuilding it
- Hierarchy numbering updates as things move
The map is for seeing. The table is for working.
They're the same structure. Which one you open depends on what you're doing — and both being true at once is what stops the plan and the work from drifting apart.
The map
Shape and gaps
Where the silos are thin, how the geo branch spreads, what a client's site looks like as a whole. The view you put on screen in a strategy call.
The table
Numbers and status
What each page targets, how it's scoring, whether it's indexed, what stage it's at. The view you work from on a Tuesday.
Both
One source of truth
Change the structure in either and it's the same plan. No exporting, no reconciling, no version that's three weeks behind.
Every module is on every plan. Plans differ only in how many clients you run.
What feeds it, and what it feeds.
- Topical Authority Planner
- The structure
- Keyword Value
- Worth
- Live page data
- Fetched
Feeds the table
What operators run alongside it.
Site Structure, answered straight.
How is this different from the topical map?
Where do the numbers come from?
Why is the table locked by default?
How does a row become an article?
Can I reorder and restructure?
Every plan includes every module.
There are no feature gates. Plans differ only in how many clients you run and how much you generate for them.