
Every grid tool draws the map. This one reads it.
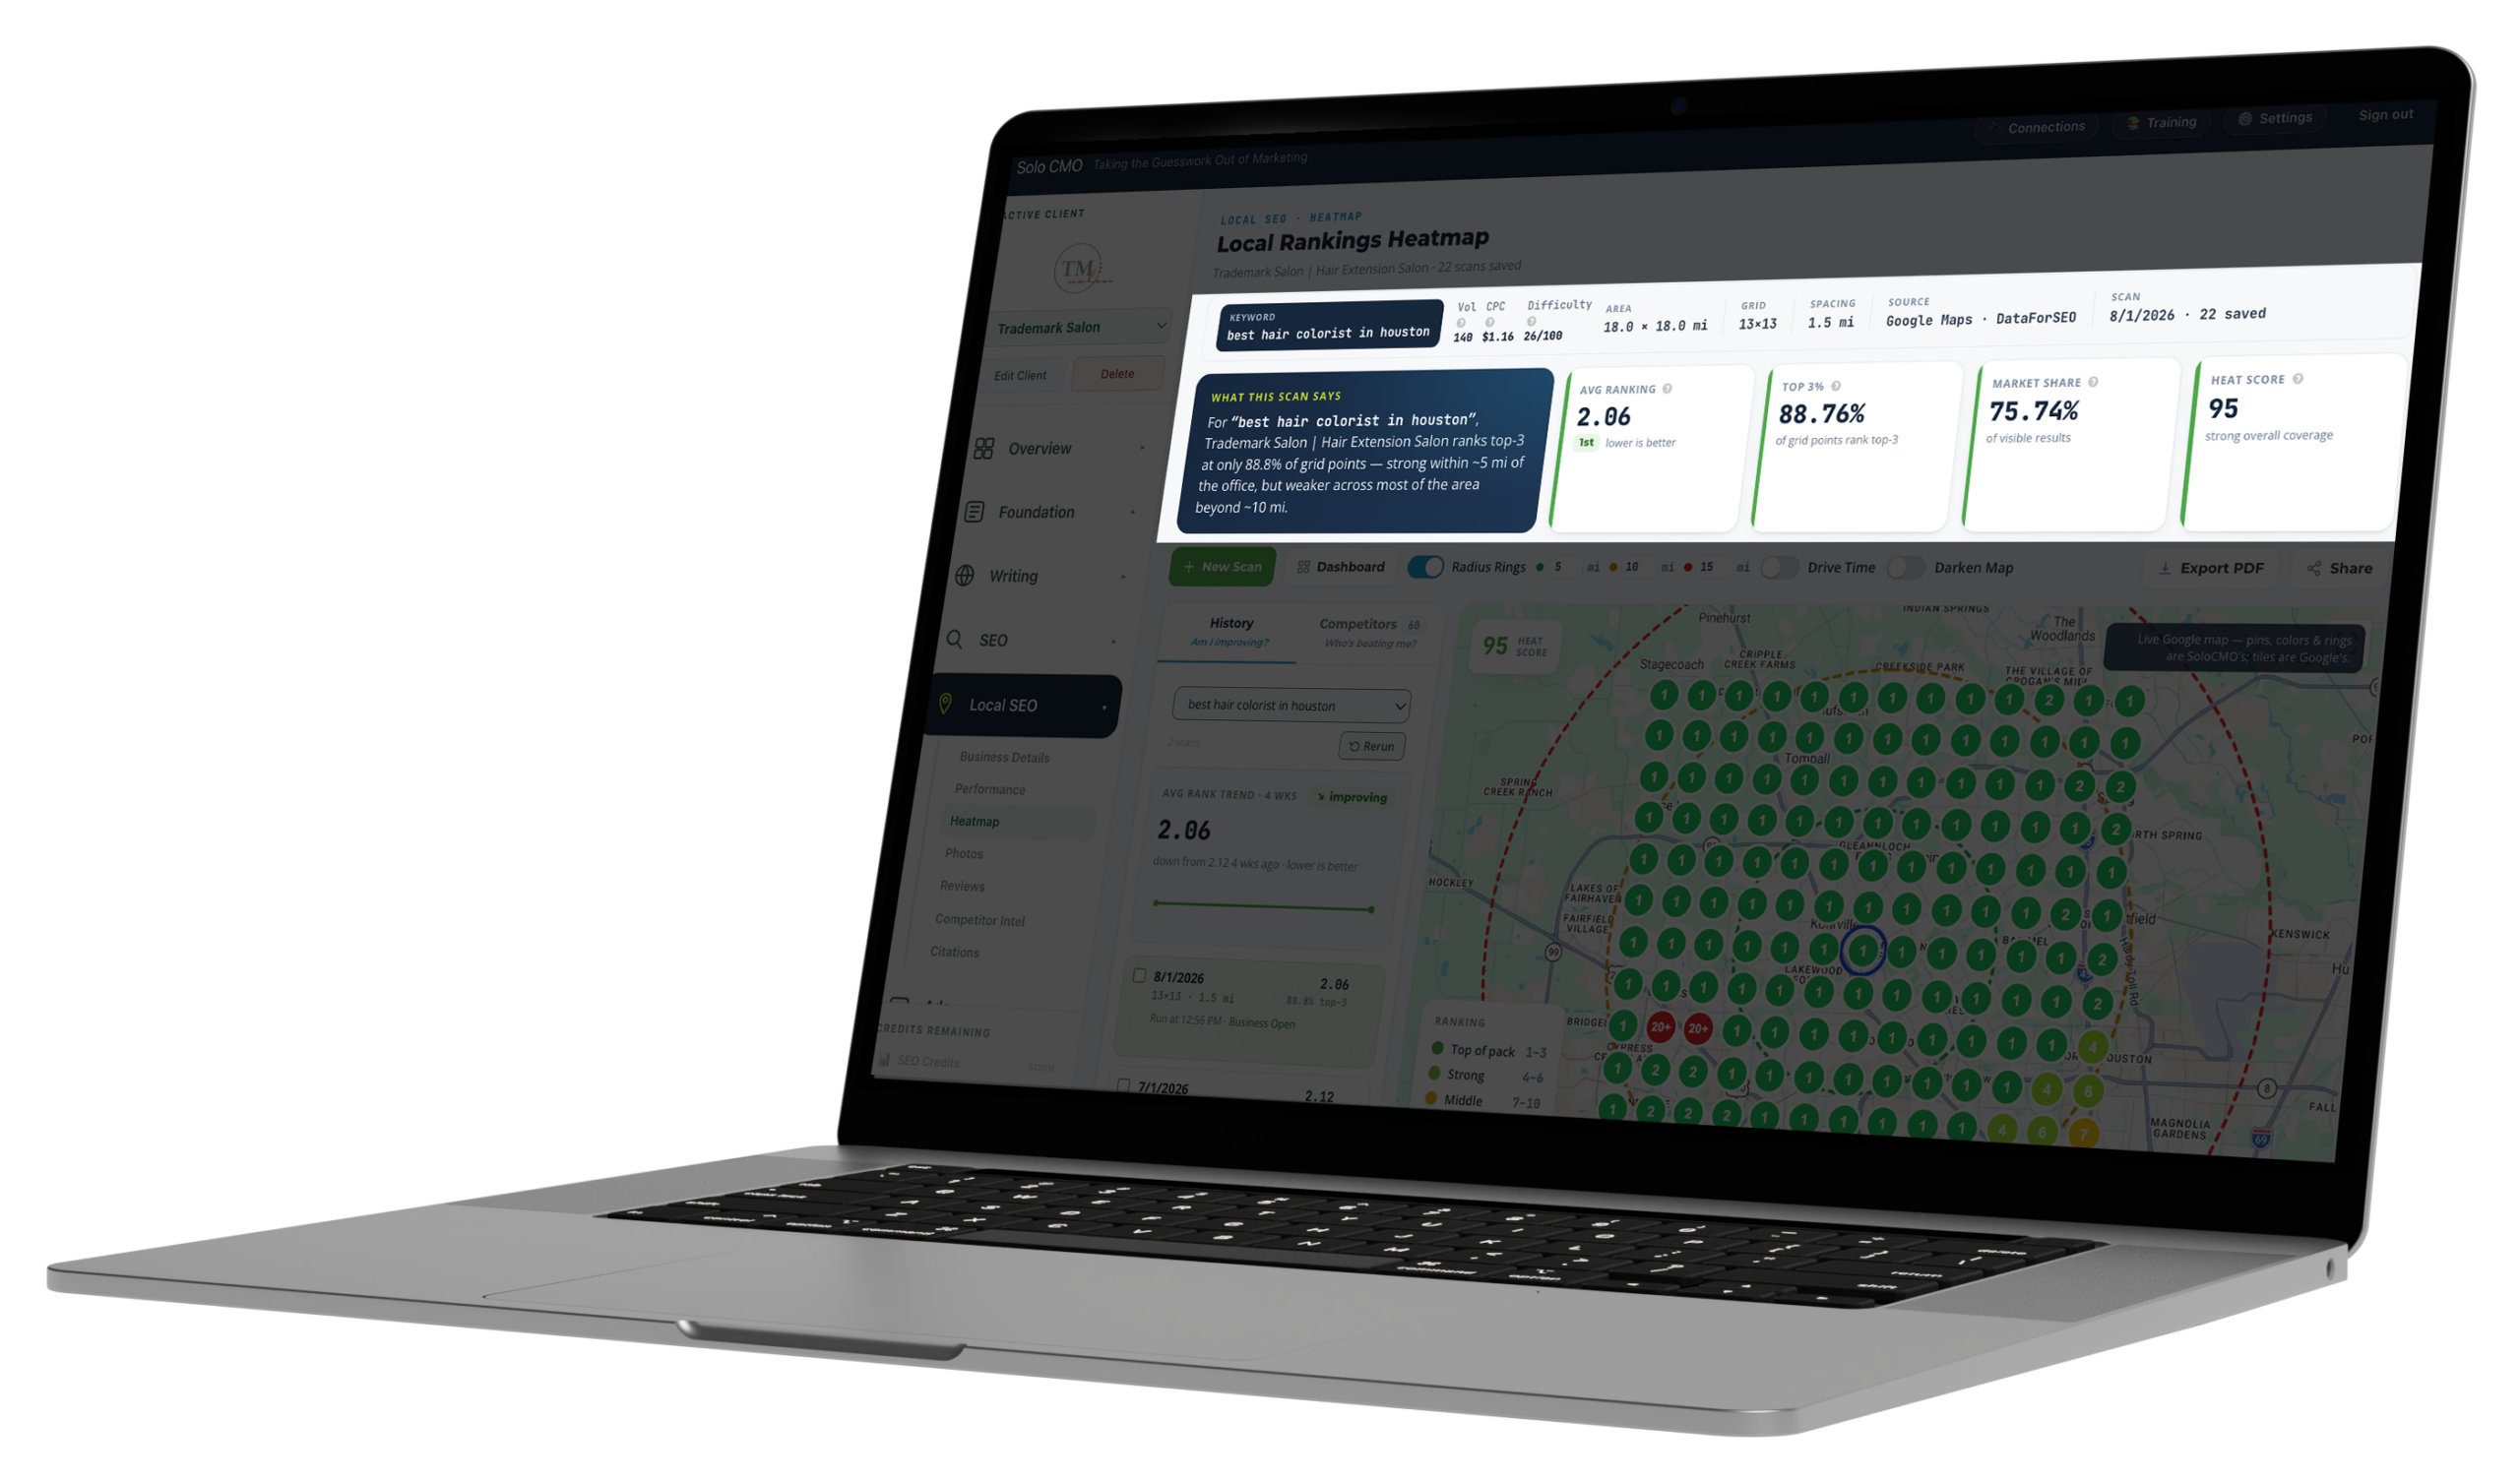
A 13×13 scan across eighteen miles, every point clickable down to the twenty businesses actually ranking there — and a Heat Score, a difficulty context and a plain-English read of what the pattern means.
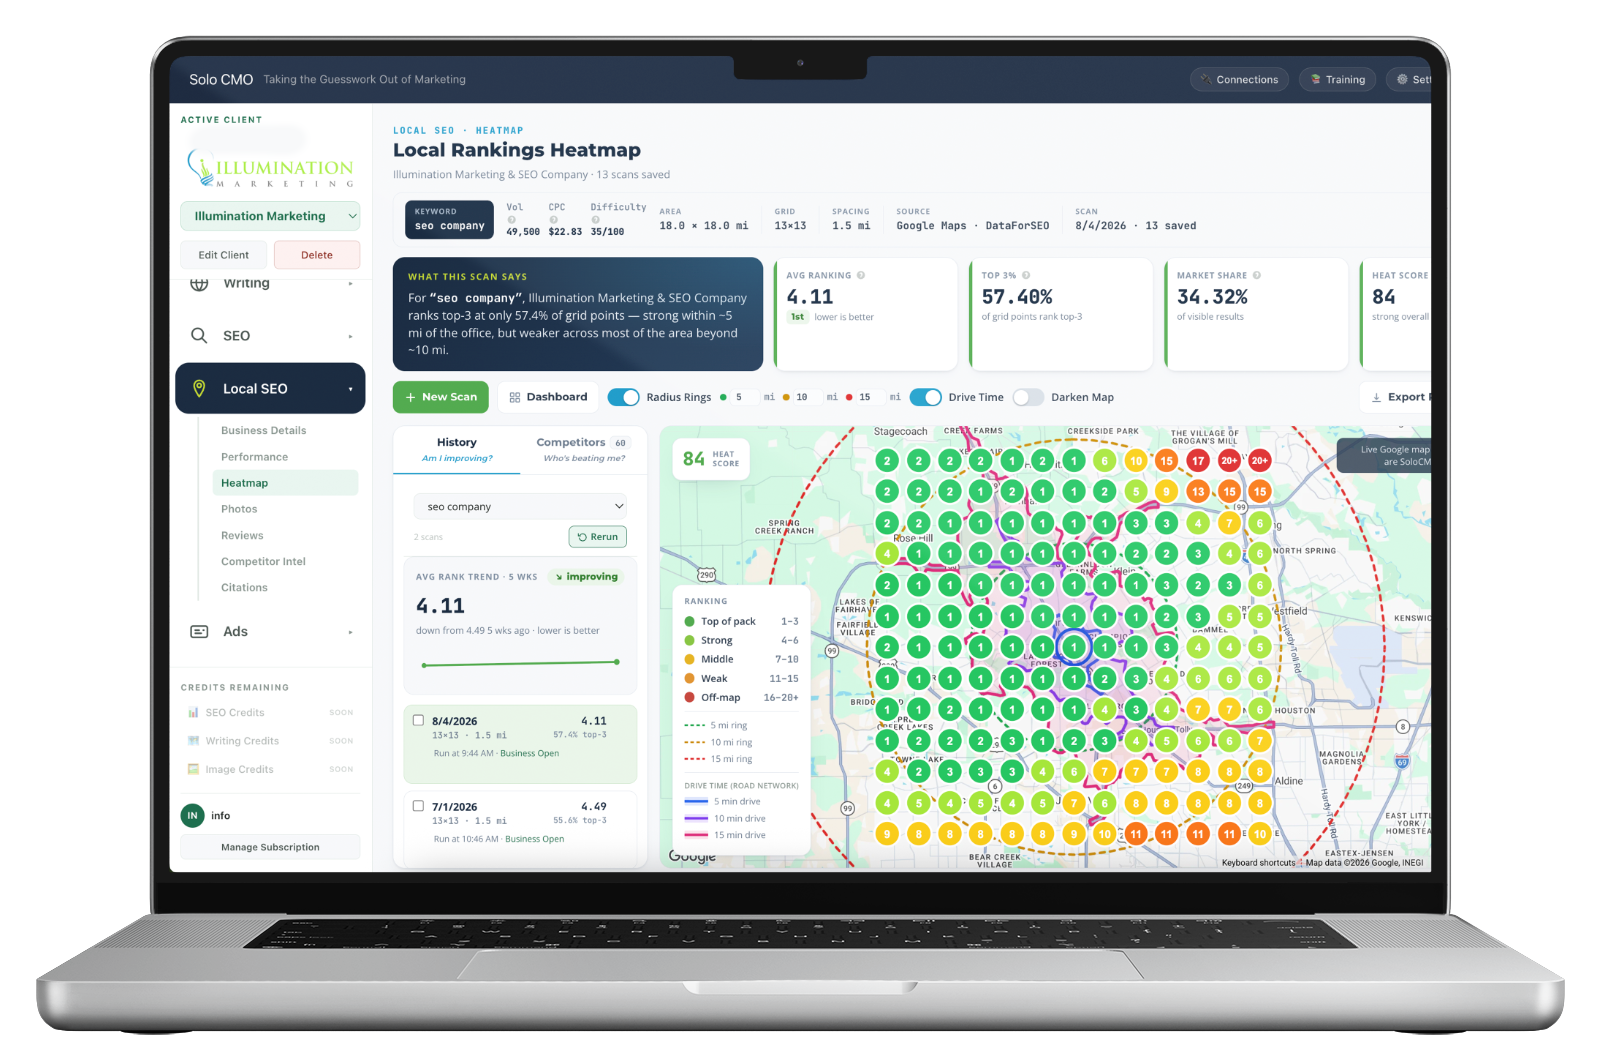
A grid is a picture. A picture isn't a diagnosis.
Run a scan in any of the standalone tools and you get a lovely coloured map that a client will nod at. Then somebody has to decide what it means — whether that ring of amber at eight miles is a problem or the natural edge of a service area, whether an average of 4.5 on a term with fifty thousand searches is good or a wasted opportunity, and what to do on Monday.
That interpretation is the actual work, and it's the part every grid tool leaves entirely to you. Which is fine at one client. At fifteen, the scans stop getting run because nobody has time to read them.
The sentence at the top is the whole point.
Every scan opens with a plain-language read of the pattern — where coverage is strong, where it falls away, and at what distance. It's the paragraph you'd have written yourself after staring at the map for ten minutes.
What this scan says
For "seo company", this business ranks top-3 at only 55.6% of grid points — strong within about 5 miles of the office, but weaker across most of the area beyond 10 miles.
Heat Score combines rank, pack coverage and share into one number — the one you actually track month to month.
Rank 12 on an easy keyword isn't rank 12 on a hard one.
Every scan carries the keyword's search volume, cost per click and difficulty score alongside the result. Sitting fourth on a term with 49,500 searches and 81/100 difficulty is a different conversation from sitting fourth on something nobody types.
Without that context a grid tool will happily let you celebrate a green map on a keyword worth nothing, and panic about an amber one you were never going to win cheaply.
- Search volume, so effort goes where the demand is
- Cost per click, as a proxy for what the term is worth commercially
- Difficulty out of 100, so expectations are set before the work starts
- Grid size, spacing and total area stated on every scan
- Data source named — no mystery about where the ranks came from
Click a point and see what a searcher standing there actually gets.
Not just your position — the full ranked list at that exact coordinate, with names, ratings, review counts and phone numbers. Which is how a rank stops being a number and becomes a specific competitor you can look up.
And a link to verify the result in Google Maps yourself, because a grid tool asking you to take its word for it is a grid tool you shouldn't be pitching from.
20 results at this grid point · Verify in Google Maps ↗
Everything a scan should have and most don't.
Drive time
Minutes, not miles
Customers choose by how long it takes to reach them. A river or a freeway can put two points the same distance out in completely different positions, and a mileage ring can't see that.
Competitors
Who's holding the squares you aren't
Every rival that appeared anywhere on the grid, with their average rank, pack share, market share and how many of the points they were found in at all.
Rings
Distance made visible
Radius rings at whatever mileages matter for this client, overlaid on the grid — so the fall-off has a number attached rather than a vibe.
Scheduling
Scans that run themselves
Set the cadence once. The history builds whether or not anyone remembered, which matters because the value of a grid is entirely in the comparison between scans.
Dashboard
Every keyword on one screen
Heat score, average rank, pack coverage, trend, volume and last scan date for each tracked term — with a rescan on the row.
Deliverable
Export or share
A PDF for the report or a link for the client. The grid is the single most persuasive artifact in local SEO — it should leave the app.
The scan is the easy part.
Plenty of tools will draw a grid, and some of them draw it well. The difference is what surrounds the picture, and whether it connects to anything else you're doing for that client.
A standalone grid tool
A map and a bill
- You interpret the pattern yourself, every time
- A rank with no volume, CPC or difficulty beside it
- Another subscription and another login
- The result lives in that tool and feeds nothing
- Someone has to remember to run it
- Competitor names, but no route to acting on them
SoloCMO
A read, in context, connected
- A plain-language read of the pattern on every scan
- Volume, cost per click and difficulty carried with the result
- Included on every plan, alongside the profile it's measuring
- Feeds the rank diagnosis as the geographic signal
- Scheduled, so the history builds on its own
- Full results at any point, verifiable in Google Maps
Every module is on every plan. Plans differ only in how many clients you run.
What feeds it, and what it feeds.
- Business Details
- The listing
- Keyword Value
- Which terms
- Google Maps
- The results
Feeds the scan
What operators run alongside it.
Heatmap, answered straight.
What is the Heat Score?
Can I see what's actually ranking at a specific point?
How is this different from a standalone grid tool?
Why does drive time matter more than distance?
Do I have to remember to run the scans?
Every plan includes every module.
There are no feature gates. Plans differ only in how many clients you run and how much you generate for them.