
Sell the revenue, not the ranking.
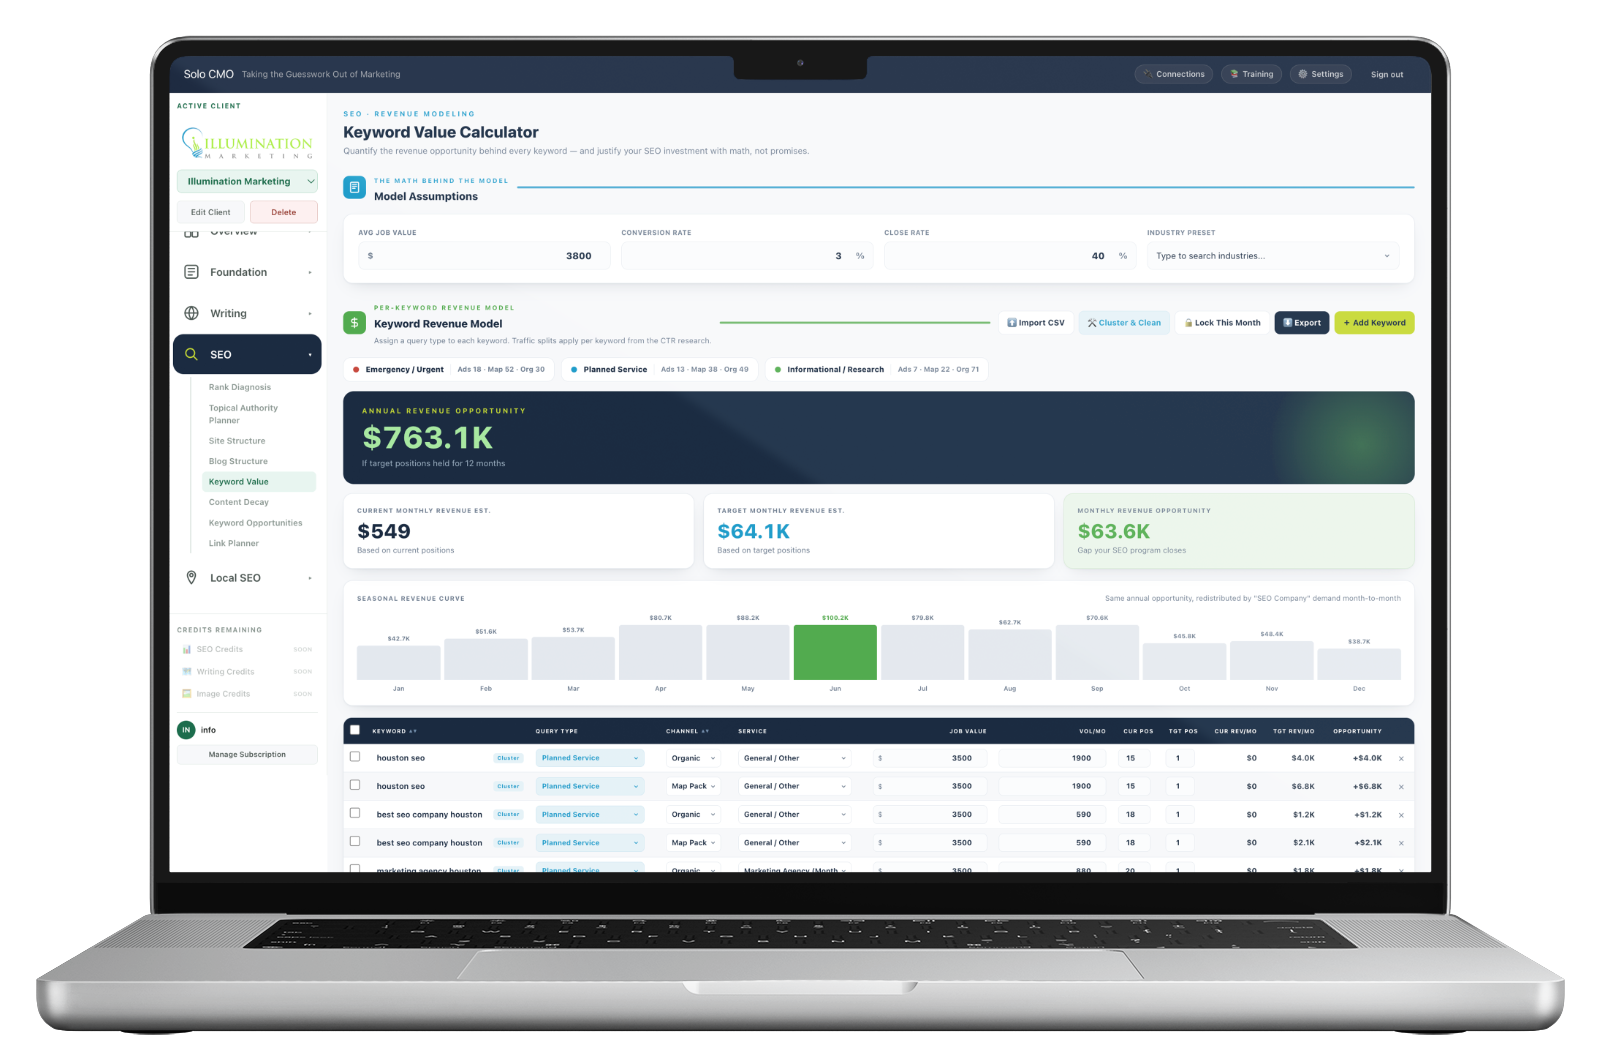
Every other tool prices a keyword by what its clicks would cost to buy. This one models what happens if the client wins it — the clicks that surface really sends, the visitors who enquire, the enquiries that close, and the value of the job at the end.
Justify the retainer with math instead of promises.
"Keyword value" in every other tool is an advertiser's number.
Volume times cost-per-click tells you what those visits would cost to rent through advertising. It's a real number, and it's the wrong one — it says nothing about whether the people searching become customers, or what a customer is worth to this particular business.
So the pitch becomes "this keyword is worth $2,400 a month in traffic value," and the owner hears a number they can't connect to anything in their bank account. Then they ask what they'll actually get, and the honest answer is rankings — which is why so many SEO retainers get cancelled by month six.
Three numbers the owner already knows.
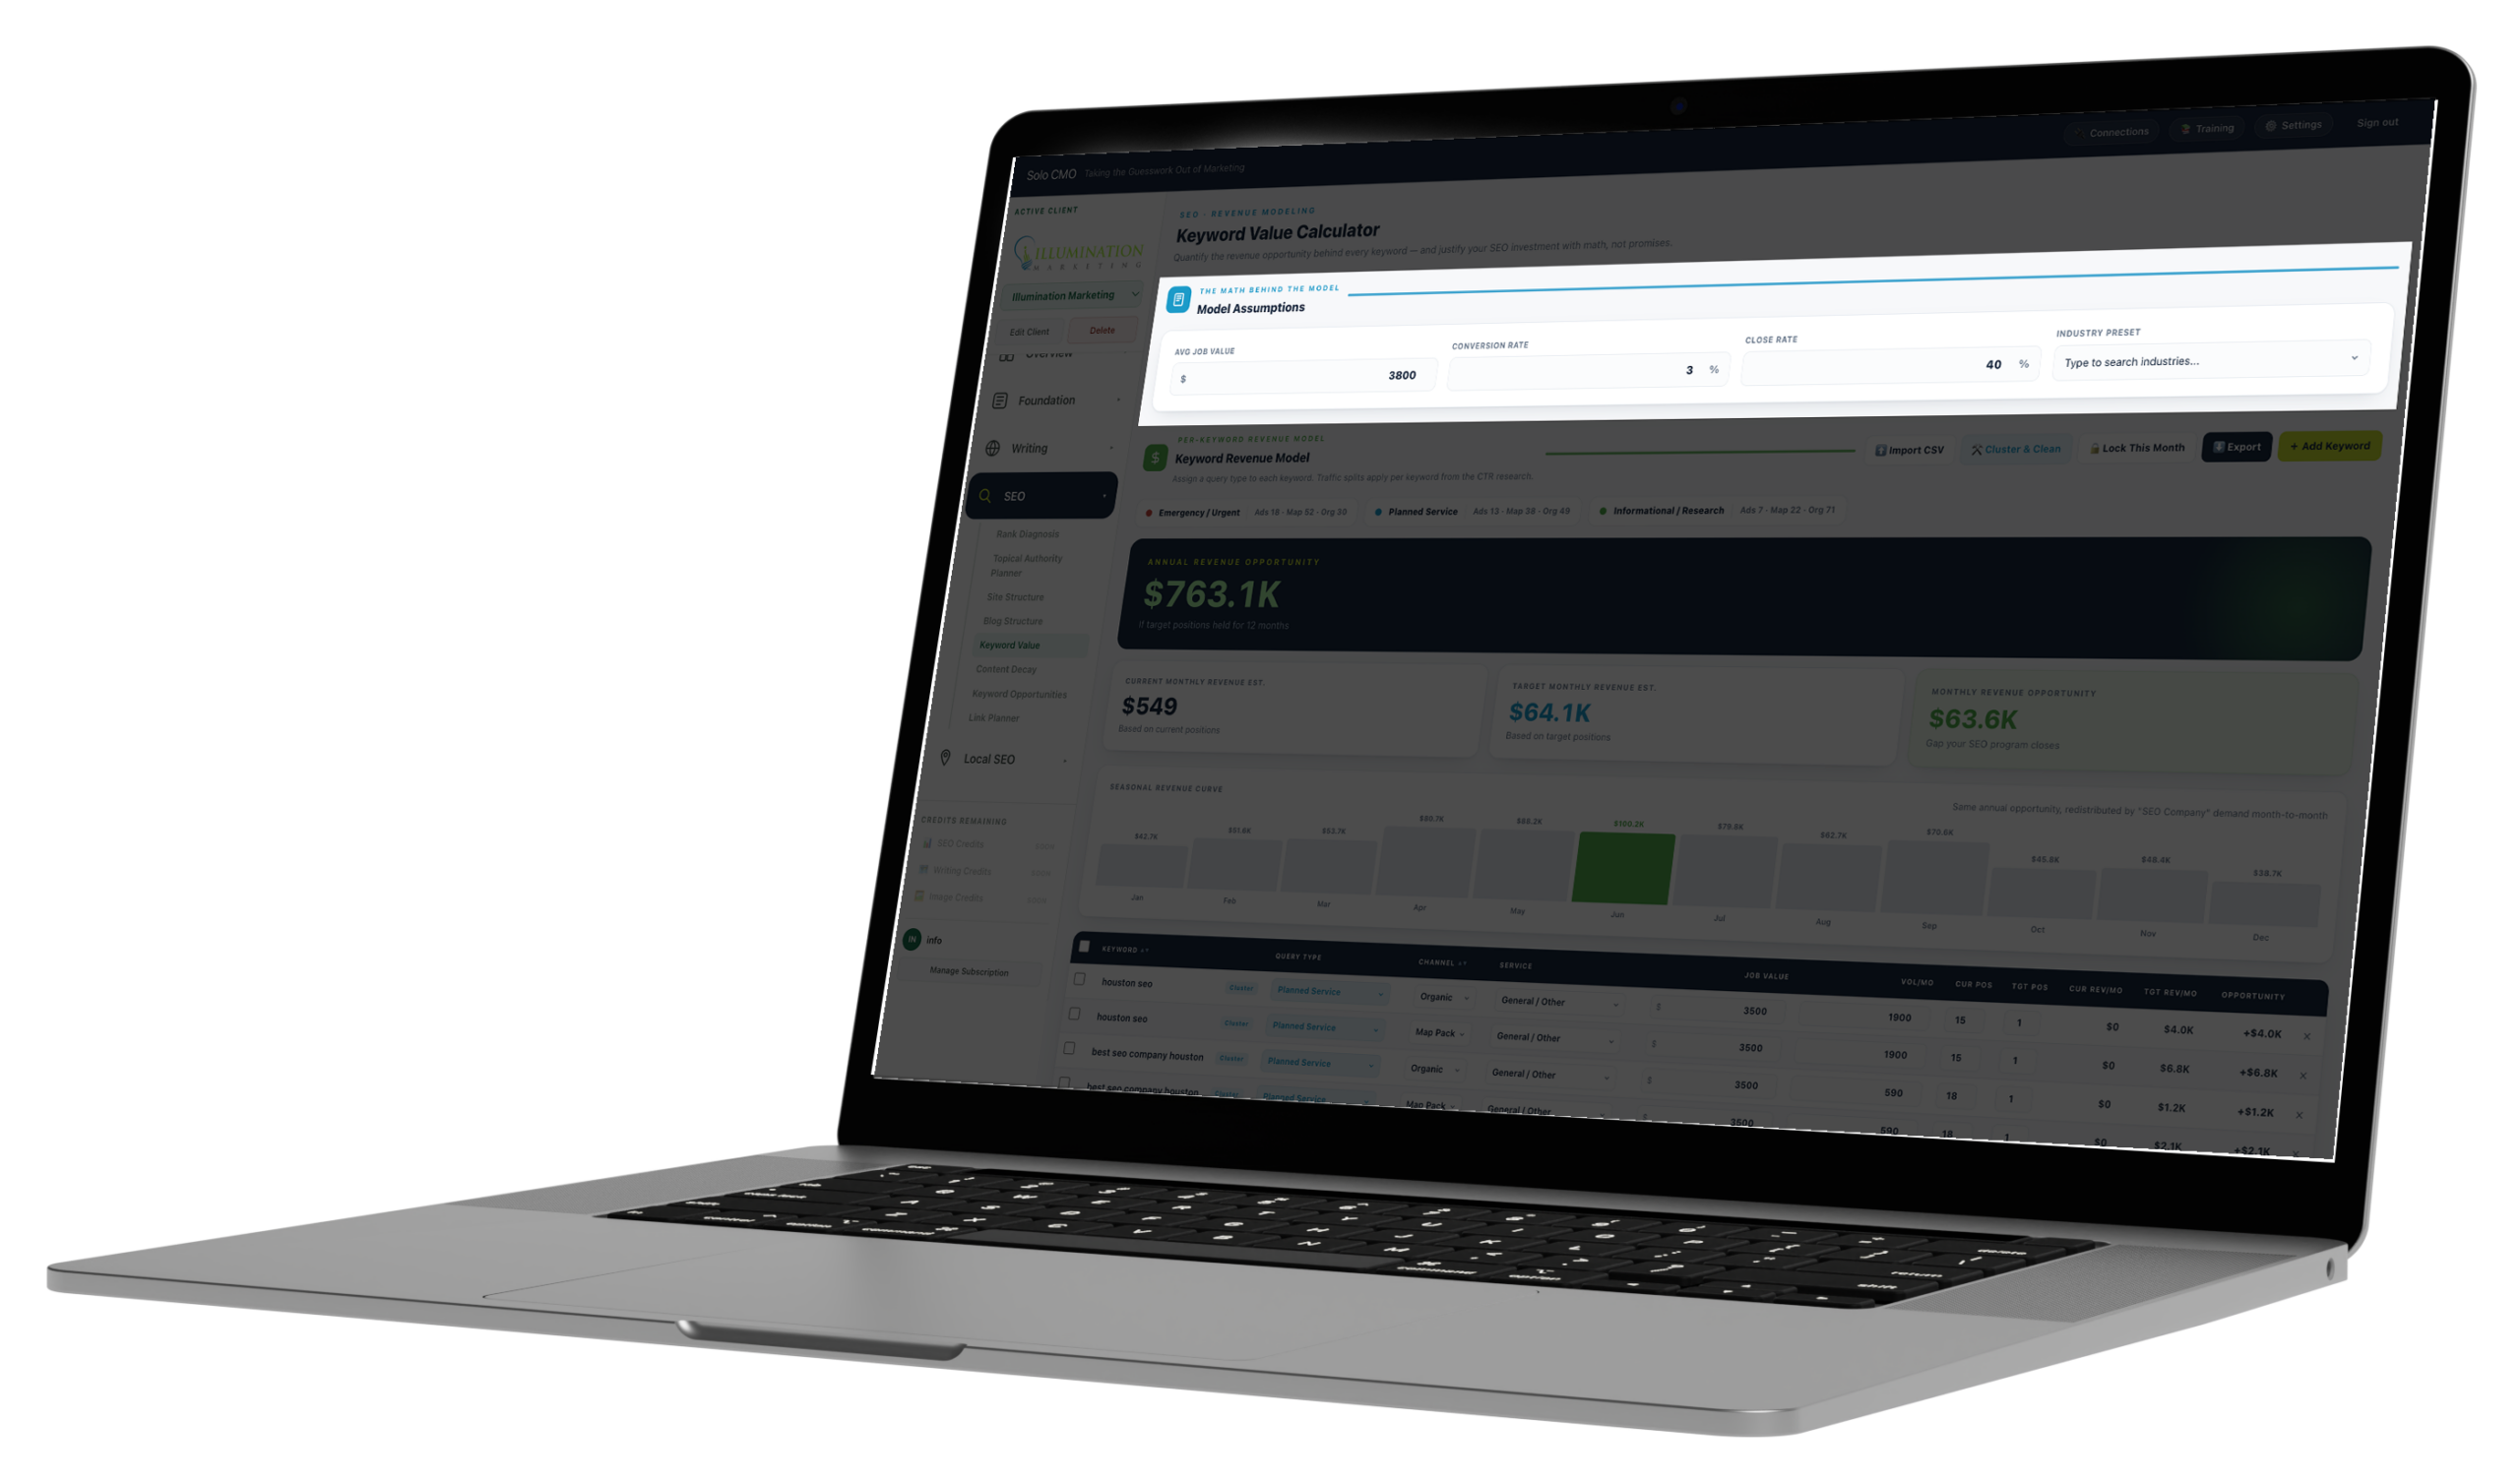
What an average job is worth, how many enquiries turn into quotes, and how many quotes close. Every business owner can answer those three, and once they have, every keyword in the portfolio has a defensible dollar figure attached to it.
Change one assumption and the whole model recalculates — which is also the fastest way to show an owner what a five-point improvement in close rate is worth to them.
- Average job value, per service where they differ
- Conversion rate from visitor to enquiry
- Close rate from enquiry to job
- An industry preset to start from when a client doesn't know their own numbers
- Every assumption visible and editable, so nothing is hidden in the math
The same keyword is worth different amounts depending on what kind of question it is.
Somebody typing an emergency query behaves nothing like somebody researching. They click different parts of the page — the map pack takes the lion's share on urgent searches, while research queries send most of their clicks to organic results.
Every keyword gets a query type, and the click share for that type flows through the whole calculation.
Emergency / urgent
They need someone today
Burst pipe, no heat, lockout. The map pack dominates, because they're calling the closest business that answers.
Planned service
They're shopping, not panicking
A remodel, a replacement, ongoing care. Clicks spread across the page as they compare a few options.
Informational / research
They're learning
How it works, what it costs, whether they need it at all. Organic takes most of the clicks and the buying decision is further out.
Two surfaces
Organic and map pack, modeled apart
A local business can win one without the other, and they're worth different amounts. Averaging them into a single number hides where the money actually is.
Honest volume
Bots discounted, not counted
Raw search volume overstates real human demand. The click share behind the model is built to discount junk traffic rather than treat every impression as a possible customer.
Clusters
Volume is the sum of variants
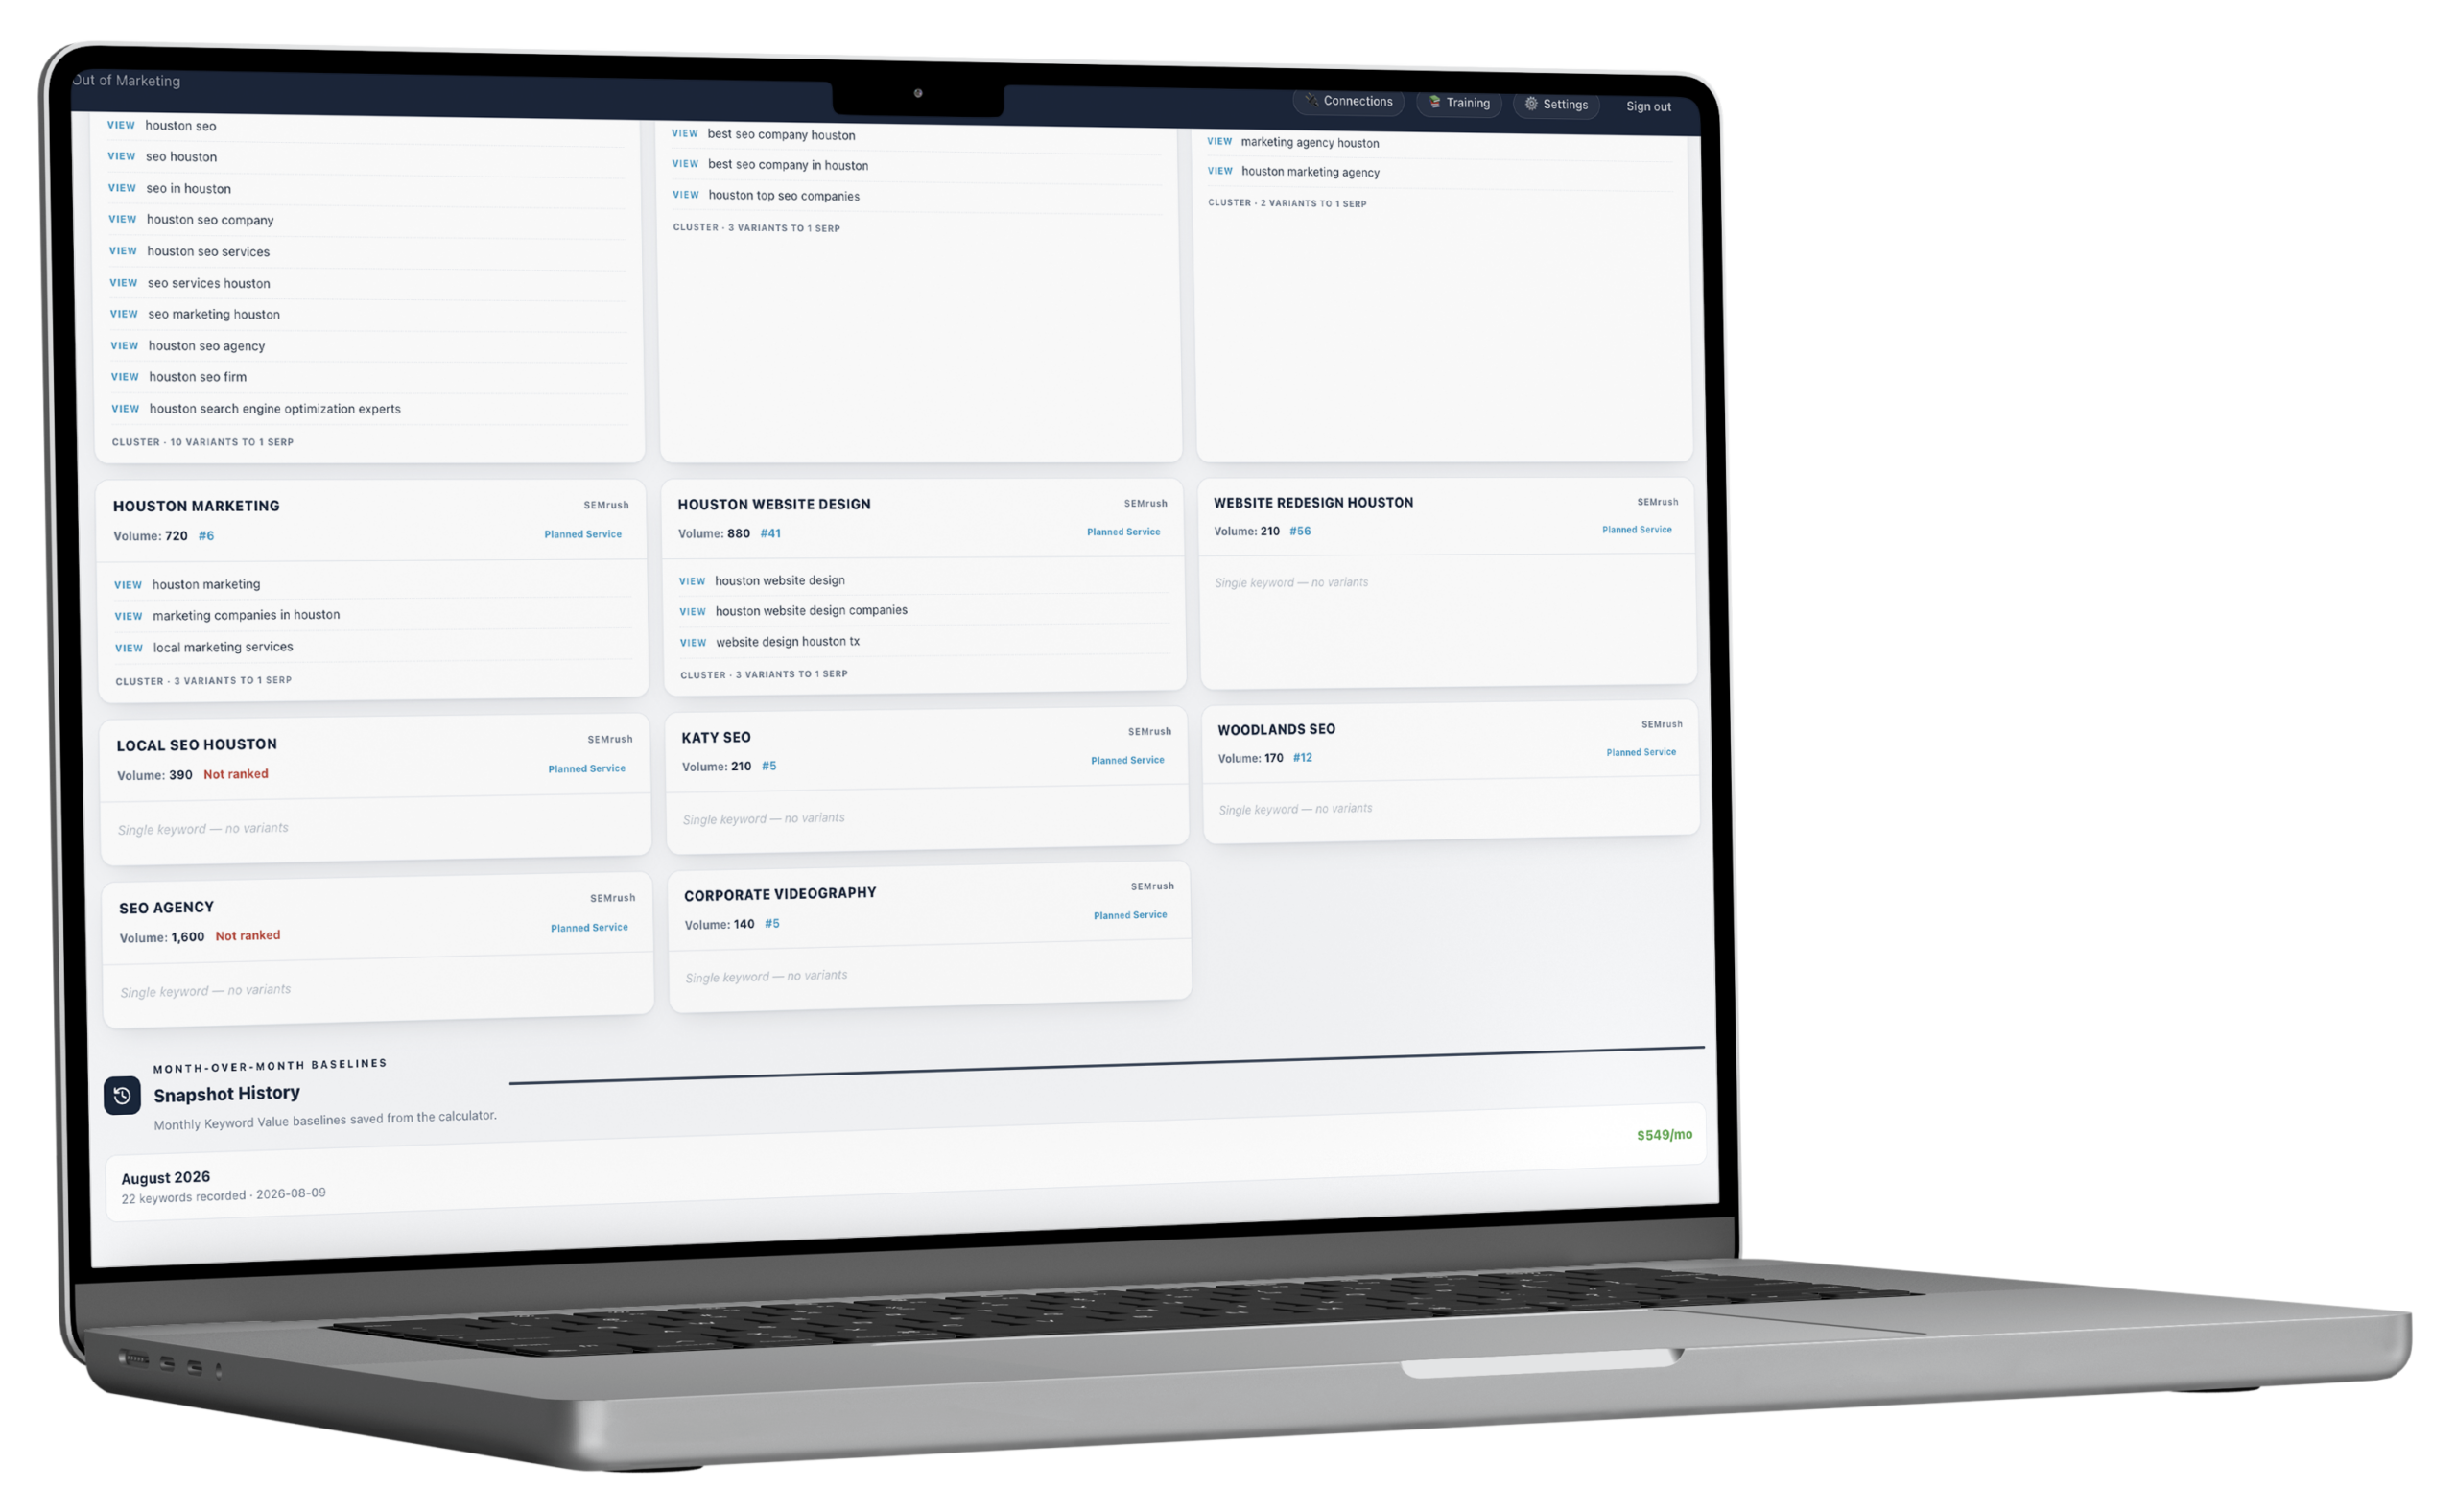
Ten ways of typing the same search resolve to one SERP. Clustering them stops a portfolio double-counting the same opportunity ten times over.
Four numbers, and a proposal writes itself.
Where the client is today at their current positions. Where they'd be at target positions. The monthly gap your program closes. And what that gap is worth over a year if the positions hold.
If target positions held for twelve months
What the current positions are producing right now.
What the same portfolio produces at target positions.
The gap the SEO program exists to close.
A real portfolio. Replace with your own before publishing, or keep it and say whose it is.
Every module is on every plan. Plans differ only in how many clients you run.
Lock the month, and the next conversation has a comparison.
A projection is a promise until there's something to measure it against. Locking a month saves the whole portfolio as a baseline — assumptions, positions and revenue figures — so the next review shows movement rather than a fresh estimate.
It also protects you. A number you saved in March is harder to argue with in September than one you recalculated this morning.
- Baselines saved per month, with the assumptions they were built on
- Import keywords by CSV, or add them one at a time
- Cluster and clean to collapse variants before the numbers are run
- Export the portfolio when the conversation needs a document
What feeds it, and what it decides.
This is the module that turns an SEO plan into an order of operations. Everything else says what could be built; this says what's worth building first.
What operators run alongside it.
Current positions, and why they are where they are.
Topical Authority PlannerEvery page that could exist, before this decides which ones should.
Site StructureWhere the build order this model produces gets tracked.
Keyword OpportunitiesValue already sitting in pages that rank without anyone planning it.
Keyword Value, answered straight.
How is this different from keyword value in other SEO tools?
Why are organic and the map pack calculated separately?
Where do the assumptions come from?
Does it account for junk traffic?
Can I show this to a client?
Every plan includes every module.
There are no feature gates. Plans differ only in how many clients you run and how much you generate for them.