
Do the math before you spend the money.
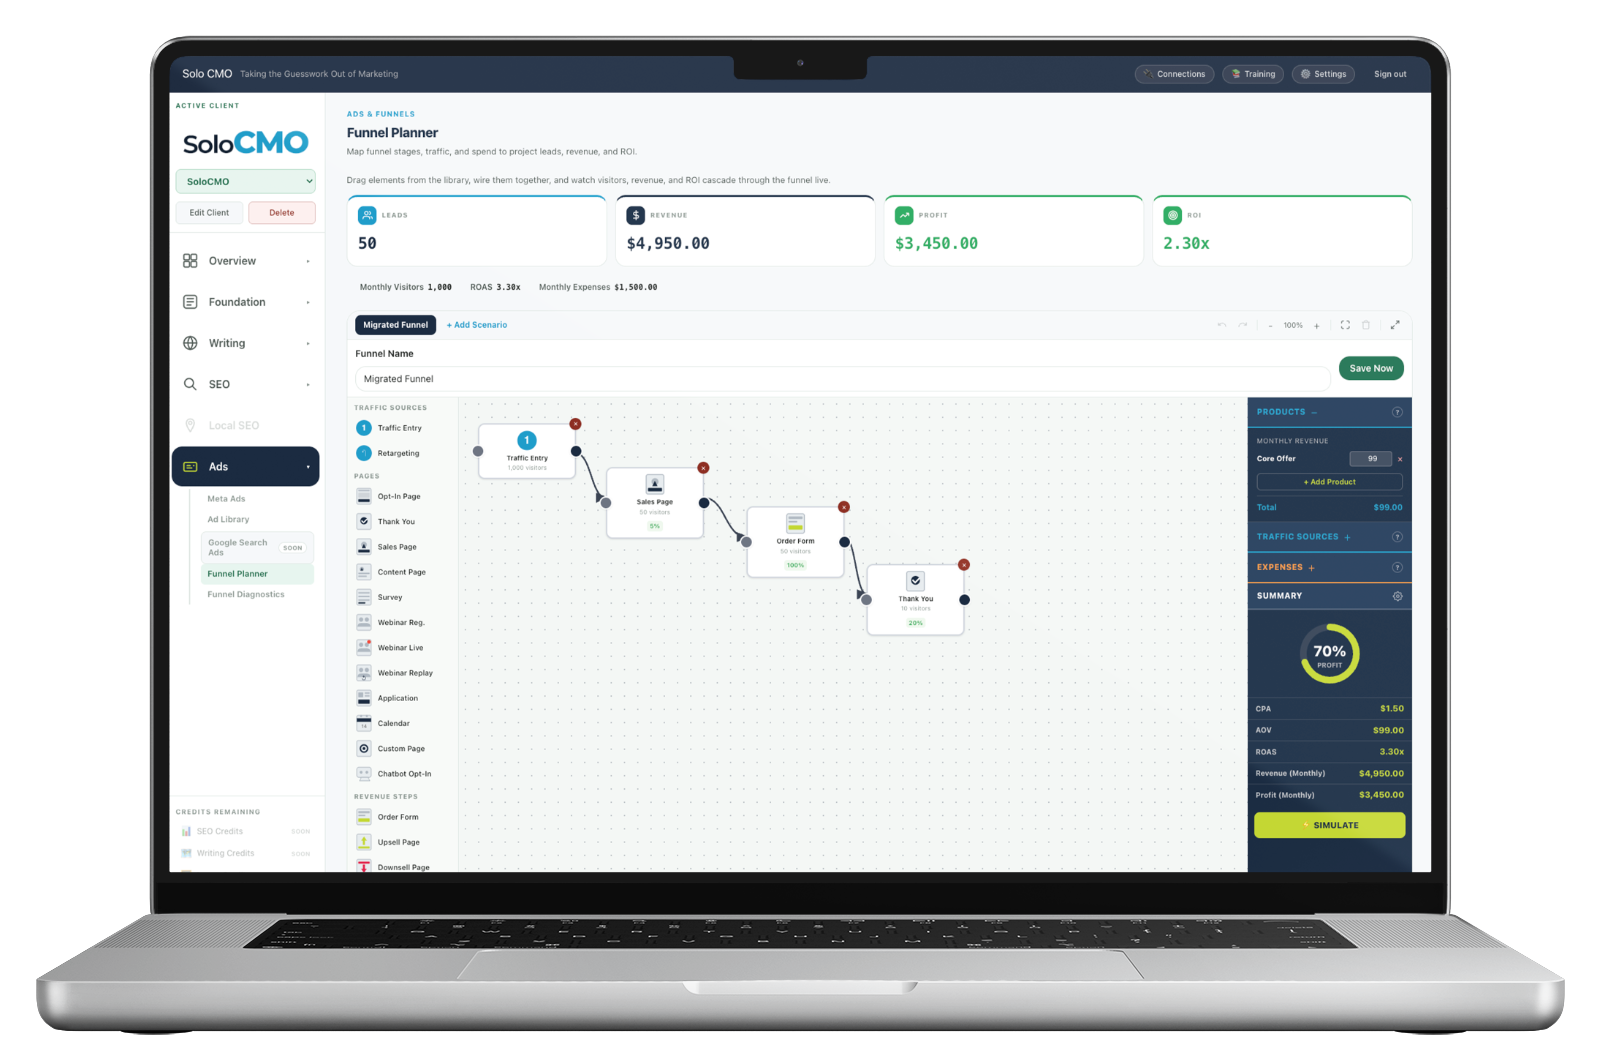
Drag the stages onto a canvas, wire them together, set the rates — and watch visitors, revenue and return cascade through the whole funnel before a single dollar moves.
Most ad budgets are set by feel and defended afterwards.
Two thousand a month sounds reasonable, so two thousand a month it is. Nobody works out what that has to produce at each stage to be worth doing, because doing it properly means a spreadsheet nobody wants to build.
Then results come in thin and the argument starts, with neither side able to say whether the plan was wrong or the execution was — because there was never a plan precise enough to be wrong.
Set the rate at each stage. Watch what survives.
Every stage takes what the one before it produced and passes on a percentage. Change any number and everything downstream moves — which makes the fragile stage obvious long before it costs anything.
Illustrative model for a local home care client. Every figure here is an assumption you can argue with — which is the point.
Build the version where it doesn't work.
Two tabs, same funnel, different assumptions. The optimistic model is the one you'd like to present; the conservative one is the model that tells you whether the campaign survives a landing page that converts at three percent instead of six.
Present both and you're the only person in the room who has thought about it honestly.
Scenario A — conservative
Page converts at 3%
- Leads
- 75
- Booked
- 10
- Revenue
- $8,500
- ROAS
- 4.3x
Scenario B — target
Page converts at 6%
- Leads
- 150
- Booked
- 21
- Revenue
- $17,850
- ROAS
- 8.9x
One assumption changed. Both models still profitable — which is the answer you want before committing, not after.
Not just opt-in and thank you.
Traffic sources, a dozen page types and three revenue steps, dragged onto the canvas and wired in whatever order the funnel actually runs.
Which matters because a webinar funnel, an application funnel and a straight lead capture have completely different arithmetic — and modelling all three the same way is how agencies end up surprised.
- Multiple traffic sources feeding one funnel, each with its own volume
- Branching paths — upsell and downsell running from the same step
- Products and expenses set separately, so profit isn't just revenue
- Undo, redo, zoom and save on a full canvas
- Every funnel kept and reusable as a template for the next client
- Traffic entry
- Retargeting
- Opt-in
- Sales
- Content
- Survey
- Application
- Calendar
- Webinar reg
- Webinar live
- Replay
- Thank you
- Chatbot
- Custom
- Order form
- Upsell
- Downsell
It's a planning tool. It sells like a proposal.
A budget request backed by a model showing what has to be true is a different conversation from a budget request backed by confidence. And it changes what happens three months later.
At the pitch
Justify the number
Show the client what their spend has to produce at each stage. Nobody argues with arithmetic they watched you build.
At the start
Agree the targets
The model states the conversion rate every stage needs. That's a shared expectation rather than a promise you'll be held to vaguely.
At the review
Point at the stage
When results come in under, the model shows which assumption was wrong — and the conversation is about a landing page instead of about your competence.
Every module is on every plan. Plans differ only in how many clients you run.
What feeds it, and what it feeds.
- Keyword Value
- Job value
- Offer
- The entry point
- Ad Library
- Real CTR & CPC
Feeds the planner
- Funnel Diagnostics
- The targets
- Meta Ads
- What to build
- Content Report
- Plan vs actual
The planner feeds
What operators run alongside it.
Funnel Planner, answered straight.
What does the planner actually calculate?
Aren't the conversion rates just guesses?
Can I compare different versions?
What kinds of funnel can it build?
Is it useful for selling the work?
Every plan includes every module.
There are no feature gates. Plans differ only in how many clients you run and how much you generate for them.