
The biggest gap isn't the biggest opportunity.
Five stages scored against benchmarks, the choke points named, and a fix list ordered by how much revenue each one actually recovers — not by which number looks worst.
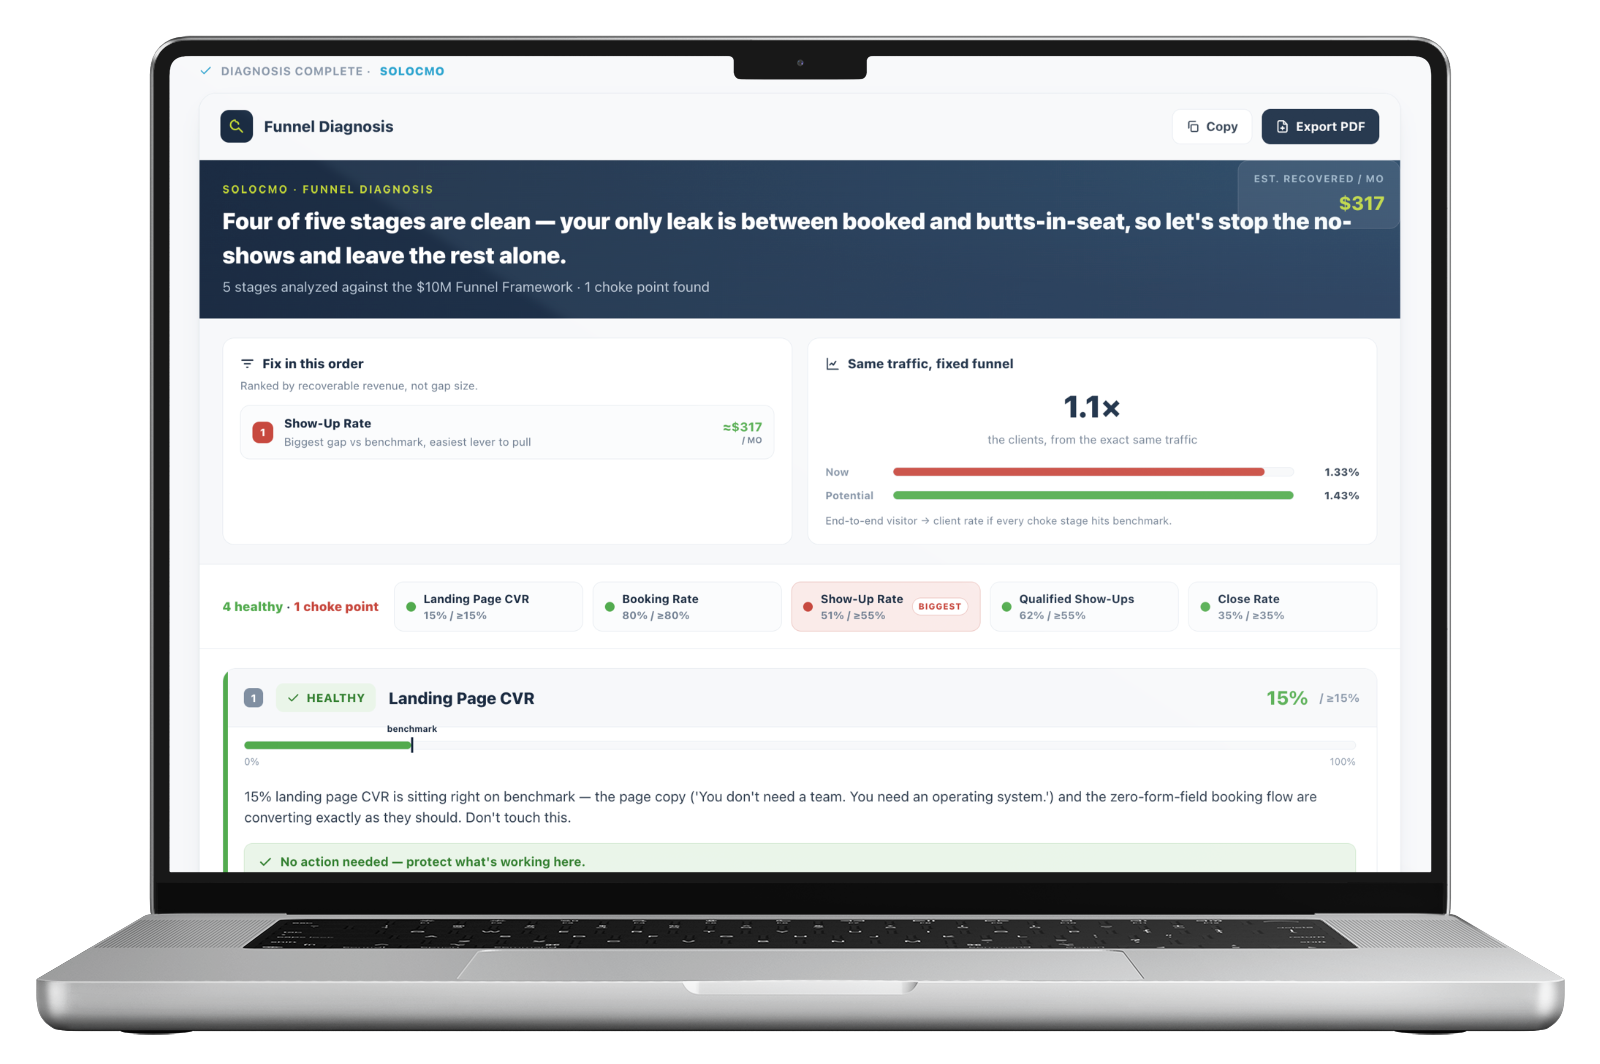
Knowing the funnel leaks is easy. Knowing which leak to plug isn't.
Every stage has a number and every number could be better. So the work goes wherever attention lands — usually the landing page, because that's the bit you can see and change this afternoon.
Meanwhile the stage that's actually costing the money sits three steps down, unmeasured against anything, quietly turning half the booked calls into nobody.
Every stage against a benchmark, not against last month.
Landing page conversion, booking rate, show-up rate, qualified show-ups, close rate. Each scored against a published standard that adjusts for whether the client sells to consumers or businesses — because "is 47% good" has an answer and most agencies are guessing at it.
Choke point detected at booking rate — below the 80% benchmark. This stage is bleeding the most revenue.
A real diagnosis. Two stages healthy, three choke points, and the worst one isn't where most people would have looked.
Ranked by recoverable revenue, not gap size.
Booking rate is six points under. Show-up rate is eight points under. But a leak early in the funnel compounds through every stage after it, so the order you fix them in isn't the order the gaps suggest.
That's the difference between a dashboard and a diagnosis — and it's the calculation almost nobody does by hand.
Biggest single leak — fixing this multiplies every stage after it.
Closes the loop on ad spend that has already converted.
Fastest leak to plug — these leads already raised their hand.
End-to-end visitor-to-client rate if every choke stage reaches benchmark. No extra budget involved.
What it means, why it's happening, and what to do on Monday.
Each choke point gets the number translated into people, a likely root cause, context specific to the client's industry, and four actions — separated into what you can do today and what needs a project.
What this means
26% of people who opt in never actually book a call — roughly 1 in 4 leads you paid for, walking away before they reach the calendar.
Most likely root cause
The booking page.
In home care, families often opt in during a stressful, time-crunched moment while researching for a parent. If the booking step isn't immediate and simple, they get pulled back into caregiving duties and never return.
Action items
Send them to the booking widget after opt-in rather than a generic confirmation page. Remove the extra click.
Limit visible slots to the next 48–72 hours. Too many options two weeks out kills momentum.
Auto-text non-bookers within ten minutes with a direct calendar link — this audience often prefers texting to email.
Real output, trimmed. The industry context is the part a generic funnel checklist can't produce.
It tells you what not to touch.
A landing page sitting exactly on benchmark while booking and show-up leak should be left alone. More leads into a broken middle doesn't produce more clients — it spends the budget faster.
That's advice against an agency's own instinct, which is why it's worth having written down.
Protect
Healthy stages named
Each one flagged as working, with a short note on why, so nothing gets "optimized" into a worse position during a redesign.
Optional inputs
Spend and deal value
Add monthly spend and average deal value and the gaps convert from percentages into money, which is the version a client understands.
Optional inputs
The actual page
Give it the booking or landing URL and the diagnosis quotes real copy instead of reasoning in the abstract.
Every module is on every plan. Plans differ only in how many clients you run.
What feeds it, and what it feeds.
The planner says what the funnel should do. This says what it's actually doing — and the gap between the two is the whole conversation.
- Funnel Planner
- The targets
- Ad Library
- Spend & CTR
- Your funnel
- Five rates
Feeds the diagnosis
- Funnel Planner
- Real rates
- Meta Ads
- Offer changes
- Content Report
- The narrative
The diagnosis feeds
Funnel Diagnostics, answered straight.
Why isn't the fix list ordered by biggest gap?
What do I have to enter?
Where do the benchmarks come from?
What does it say about the stages that are fine?
Can I send it to the client?
Every plan includes every module.
There are no feature gates. Plans differ only in how many clients you run and how much you generate for them.