
Google keeps six months. You keep all of them.
Eighteen months of Business Profile history pulled in the day you connect a client, then every day after that recorded and stored. Calls, views, website clicks, direction requests — kept, not rolled off.
Which means you can finally compare this July to last July.
Every month, a month of the client's history disappears.
Google's own performance tab shows the current month and the previous five. As a new month arrives, the oldest one falls off the back — permanently, as far as the interface is concerned. Nobody exports it, because nobody thinks about it until the day they need it.
So when a roofer asks whether this storm season is better than last one, or a home care client wants to know if the holiday dip is normal, the honest answer is that the data is gone. And year over year is the only comparison that means anything in a seasonal business, which every local service business is.
One of these windows moves. The other only grows.
Eighteen months are backfilled the day a client connects, and every day since is written to a table and kept. The record starts longer than Google's and gets longer every day you stay.
The shaded stretch is what a client loses by relying on Google's interface — and it's exactly the stretch a year-over-year comparison needs.
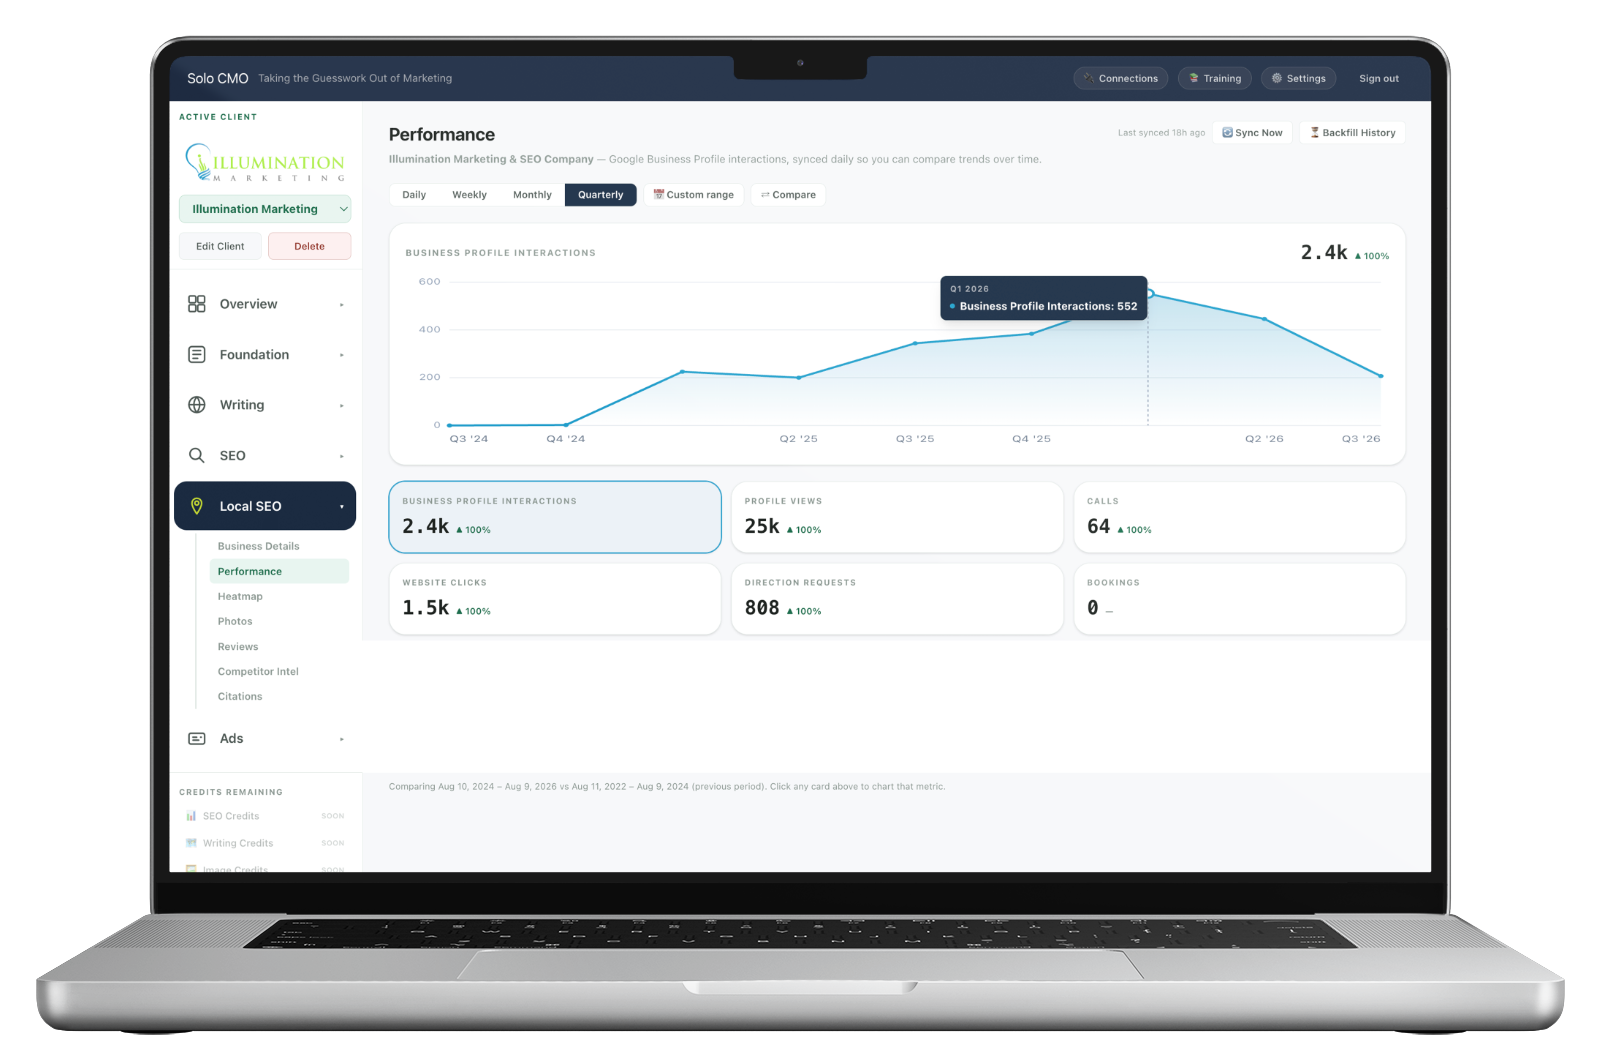
Six metrics, and the ones that count are the actions.
Views tell you the profile is being found. Calls, direction requests and website clicks tell you it's working. Click any card to chart that metric across whatever period you've selected.
A real profile compared against the preceding two years. The comparison window is stated on screen, so there's never a question about what's being measured against what.
Daily for a campaign. Quarterly for a board.
The same stored data, read at whatever resolution the conversation needs. Daily when you're checking whether a change landed, monthly for the client report, quarterly when someone wants to know if the whole year is working.
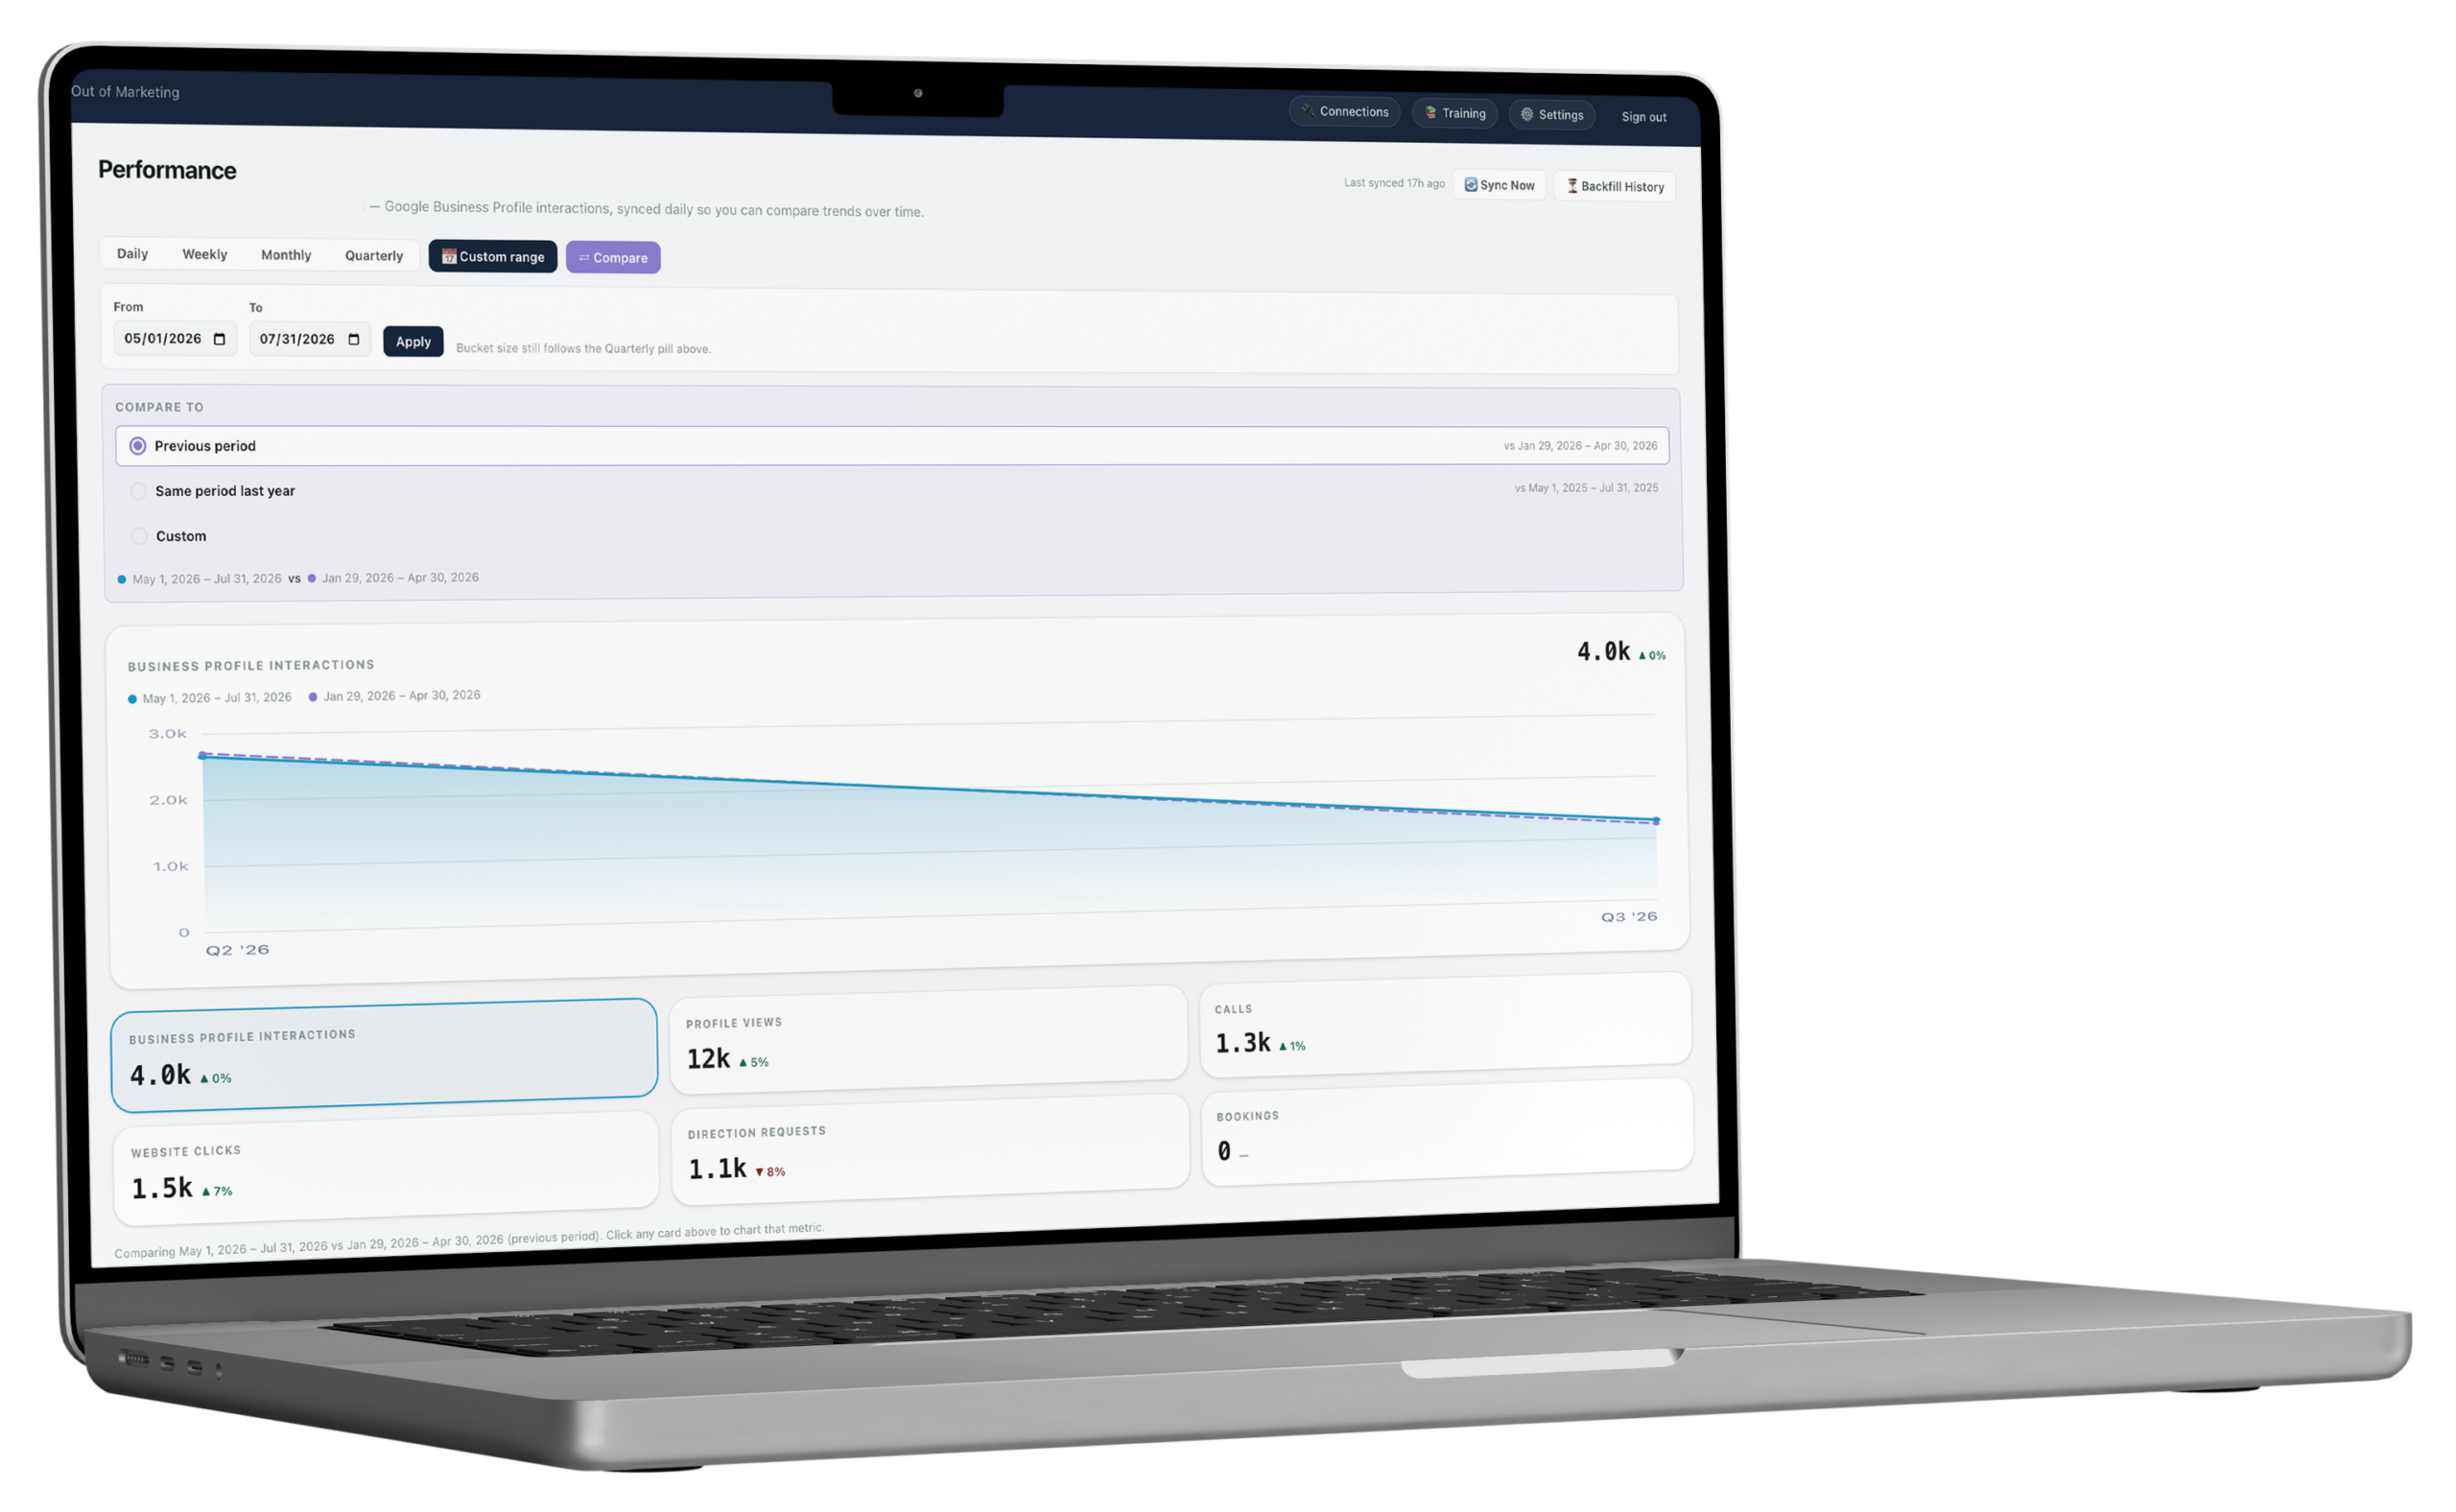
Then pick any custom range and compare it against the period before it, which is only possible because the period before it still exists.
- Daily, weekly, monthly and quarterly views of the same record
- Any custom range, compared against the preceding period of equal length
- The comparison window stated in plain language under the cards
- Synced daily, with a manual sync before a client call
- Backfill run again at any time if a connection was interrupted
Three conversations you can only have with the data.
Seasonality
"Is this dip normal?"
Every local service business has a slow stretch. Without last year's numbers, a normal January looks like a failure and a client starts questioning the retainer.
Attribution
"Did that actually work?"
You fixed the categories in March. Whether calls moved because of it, or because it was March, is a question only a year of history can answer.
Renewal
"What have you done for us?"
The most dangerous question in an agency relationship, and the easiest one to answer with two years of profile actions on a single chart.
Every module is on every plan. Plans differ only in how many clients you run.
What feeds it, and what it feeds.
- Google Business Profile
- Daily sync
- Business Details
- The profile
Feeds Performance
What operators run alongside it.
Performance, answered straight.
How far back does the data go?
Why can't I just use Google's own performance tab?
Which metrics does it track?
Can I compare two specific periods?
How often does it update?
Every plan includes every module.
There are no feature gates. Plans differ only in how many clients you run and how much you generate for them.