
Marketing Strategy

A below-average funnel conversion rate almost always comes from one of five causes: mismatched traffic, a weak landing page or offer, poor follow-up, weak lead qualification, or the wrong benchmark. You don’t need a week of guessing to find the cause. A structured funnel diagnostic can find it in hours. If you’d rather hand the work off, that’s exactly what a professional funnel diagnostic does.
Key Takeaways
- The five most common causes of a low funnel conversion rate are traffic mismatch, a weak landing page or offer, poor follow-up, weak lead qualification, and measuring against the wrong benchmark.
- Industry average shifts a lot by funnel type. Ecommerce, B2B SaaS, lead gen, and local service funnels don’t share the same baseline.
- A stage-by-stage diagnostic finds the leak faster than a full-funnel rebuild.
- Solo marketers rarely finish a manual audit. Every stage lives in a different tool, and rebuilding assets from scratch adds even more time.
- Fix the leak with the highest impact and lowest effort first. Don’t try to fix every stage at once.
What Counts as Industry Average for Your Funnel?
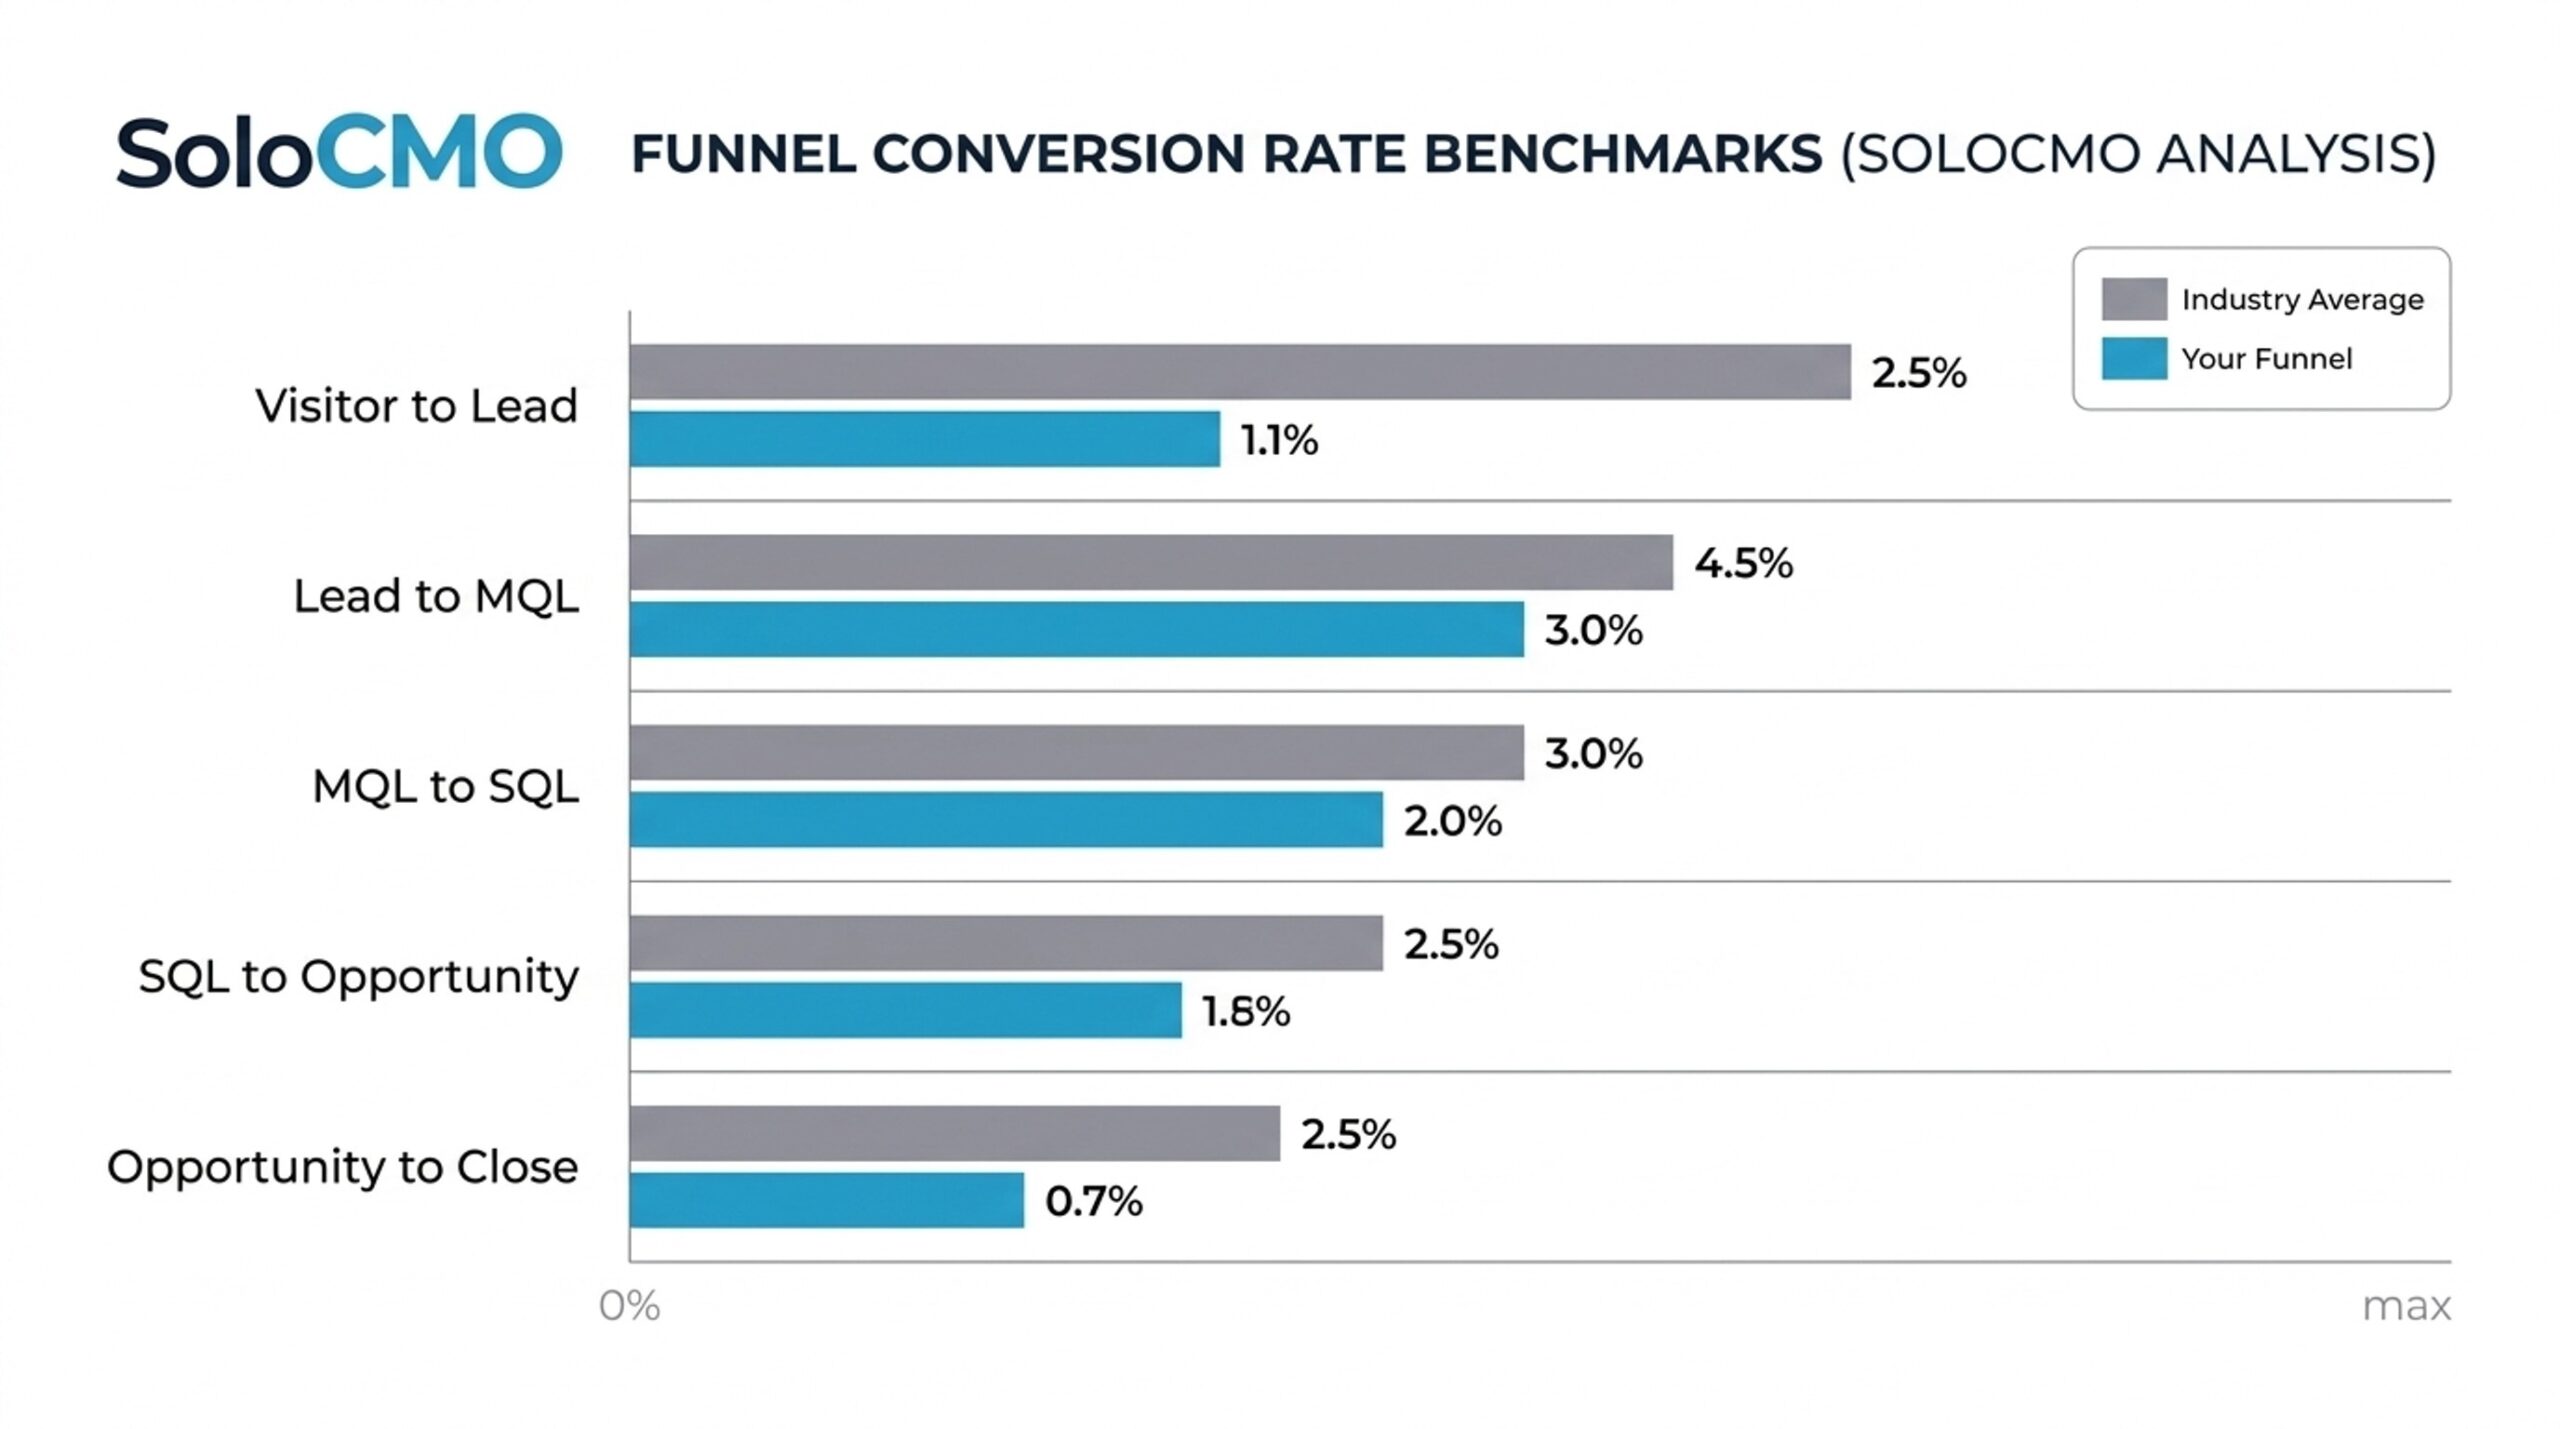
Before you diagnose anything, check whether you’re actually underperforming or just using the wrong benchmark. Industry average conversion rates swing a lot based on funnel type, offer complexity, and how long your sales cycle runs.
Benchmark Table by Funnel Type
| Funnel Type | Typical Conversion Rate | Source |
|---|---|---|
| Ecommerce (site-wide) | 2-3% | WordStream |
| Paid search landing pages (across industries) | roughly 2.35% average, top 25% near 5%+ | WordStream |
| B2B SaaS (visitor to trial/demo) | 1-3% | HubSpot benchmark reports [2] |
| Lead gen (form fill on landing page) | 3-6% | Marketing funnel benchmark reports [2] |
| Local service (contact form or call) | 5-10% | HubSpot benchmark reports [2] |
Use industry benchmarks as a starting point, not a final answer. A sales funnel selling a $40 product converts nothing like a B2B funnel selling a $40,000 contract.
Why Company Size and Sales Cycle Change the Number
A longer sales cycle almost always means a lower conversion rate at the top of the funnel. More people need nurturing before they’re ready to buy. Company size matters too. HubSpot’s benchmark data shows larger companies often post higher top-of-funnel numbers. That’s usually because of brand recognition, not better funnel design [2].
Check which category actually applies to you before you panic. Don’t judge a B2B funnel with a 90-day sales cycle against an ecommerce checkout rate. And don’t expect a visitor at an early funnel stage to convert at the same rate as one already in a demo queue. Keep your fix strategy aligned with your real funnel type, not a generic target, so the benchmark you chase actually matches the funnel you’re running. Chasing a number that doesn’t match your sales cycle wastes effort on the wrong problem.
If you’re still not sure which category fits, it’s fair to want a second opinion. It’s a quick gap to close before you spend real hours on a fix.

What Causes a Low Funnel Conversion Rate? The Stage-by-Stage Diagnostic
The Decision-Tree Framework
Once you know your real benchmark, run the diagnostic in order: traffic quality, then landing page and offer, then follow-up, then lead qualification. This order matters. If the wrong people are arriving, nothing downstream will fix your conversion rate. Each stage either rules itself out or points you to the next one. Each stage also marks a different point where visitors get lost, for different reasons.
Traffic Quality Check: Are the Right People Even Arriving?
Ask three questions. Are your visitors coming from organic search, paid, or referral sources that actually match your ideal customer? How does your click-through rate compare to WordStream’s channel benchmarks for your industry [1]? And does Google Analytics 4 show plenty of traffic, but almost no engaged time on page?
Compare your traffic sources side by side. This often shows that one channel is quietly dragging down your overall conversion rate while the others convert just fine.
The red-flag metric here is a CTR well below the channel benchmark, or high traffic paired with near-zero time-on-page. Rising acquisition costs next to a flat conversion rate is another sign you’re buying the wrong attention. It hurts your ROI even if the raw traffic numbers look healthy on paper.
The fastest fix: tighten your targeting and add audience exclusions before you touch a single word on the landing page. If traffic quality is broken, a redesigned page won’t help. It won’t help you convert more of the visitors you’re already paying for. Once traffic looks clean, verify the result again after one more day of data. That way you move to the next stage with confidence instead of guessing.

Landing Page and Offer Check: Is It a Leaky Funnel or a Weak Message?
If traffic checks out clean and conversion is still low, the leak usually lives on the page itself.
Diagnostic Questions for Landing Page and Offer
- Is bounce rate high even though you’ve confirmed the traffic is qualified?
- Does a session recording in Hotjar show visitors abandoning at one specific friction point, like a long form, slow load, or unclear CTA?
- Does the offer on the page actually match what the ad or referral link promised?
High bounce rates paired with a low opt-in rate, despite confirmed qualified traffic, is the clearest sign of a leaky funnel. This is often a user experience problem, not a traffic problem. A common cause is a mismatch between the ad’s message and the language on the landing page. The visitor clicks expecting one thing and lands on something else. This is often the same disconnect behind why your buyer persona isn’t converting, even when traffic volume looks fine. Left alone, these friction points quietly cap how many qualified visitors ever convert, no matter how much traffic you send to the page.
The Fastest Fix: Isolate One Friction Point, Not the Whole Page
Run an A/B test on the single biggest friction point first. That’s usually the headline, the form length, or the call to action. Tools like Unbounce make it fast to build a variant without touching the whole page. Hotjar’s heatmaps show you exactly where attention drops off before you commit to a full rebuild. Treat this as a conversion rate optimization task, not a redesign project. The goal is one measurable improvement, not a new page or a compound set of changes you can’t attribute results to. Make sure the fix you ship stays aligned with the original ad promise, or you’ll just create a new mismatch further down the funnel.

Why This Is Harder When You’re a Team of One
Follow-Up and Lead Qualification: The Stages Most Often Left Unaudited
Traffic and landing pages get most of the attention because they’re easy to see. Follow-up and lead qualification usually don’t, and that’s where leaks hide the longest. Check your onboarding sequence for gaps. Check whether your MQL criteria match what sales actually wants at the handoff. A slow response to a new lead, or a follow-up email sent three days late, quietly kills conversion at every stage without ever looking like an obvious problem.
Where the Time Actually Goes
Here’s the honest problem. A full diagnostic means switching between Google Analytics 4, Hotjar, Unbounce, and your email platform, then piecing the data together by hand. Most CRO advice assumes a team that can split this work up: one person on analytics, one on design, one on copy. That team doesn’t exist for you.
By the time you finish diagnosing one stage, the fix backlog from the other three has already grown. Small delays like this add up across every stage of the funnel until the whole diagnostic feels unmanageable. The audit itself becomes the bottleneck, not the funnel, and small unresolved leaks can compound into a much larger conversion problem over a few months.
This is exactly the gap SoloCMO’s product is built to close. It’s built to multiply output for a single marketer, not for the team-based, seat-based workflows that enterprise martech suites assume you have.
You’re not doing anything wrong if you haven’t finished a full audit yet. Most solo marketers haven’t. The tool-switching alone eats up the time they’d need to act on what they find.

Which Funnel Leak Should You Fix First?
The Impact-vs-Effort Rule
Not every leak deserves your attention this week. Rank each leak you’ve found by revenue impact against effort to fix. A high-CAC traffic leak often has the biggest impact on Customer Acquisition Cost (CAC), but takes the longest to fix. A landing page friction point usually has the fastest fix-to-result ratio of any stage.
The simple rule: fix the leak that’s lowest effort and highest impact first. That gives you early proof the fix is working before you move to the next stage. It’s also the fastest way to show ROI on the time you spend fixing it. Trying to fix everything at once is how solo marketers burn their one open week and end up with nothing shipped.
Use Marketing Qualified Lead (MQL) volume as your metric for deciding whether a follow-up or lead qualification leak is worth fixing first. If MQL volume is healthy but close rate is low, the leak is downstream, not at the top. That often traces back to 5 signs your ideal customer profile is too vague. That means the fix needs to target a later funnel stage, not the pages driving initial traffic, and your MQL criteria need to align with what sales is actually closing. Fixing the wrong stage first costs you weeks of wasted effort with no movement in the number that matters.
How AI-Assisted Rebuilds Compress the Fix Timeline
Rebuilding a landing page variant or rewriting a follow-up sequence used to eat a full week. AI-assisted campaign rebuilds, including ICP refinement, landing page variant generation, and follow-up sequence drafting, compress that into a single-day sprint. That’s the practical unlock for someone without a team to hand things off to. It’s what actually lets you improve conversion instead of just diagnosing it and running out of time before you fix it. More of your existing traffic converts, instead of leaking out at the same stage every month.
Conclusion
The number that scared you into reading this article almost always comes down to one fixable stage, not a full rebuild. Once you know whether the leak sits in traffic, the landing page, follow-up, or lead qualification, the fix itself is usually smaller and faster than you feared.
If you’d like a second set of eyes on where your funnel is actually leaking, you can get a free funnel diagnostic estimate. You’ll get the stage-by-stage answer without spending your one open day this week piecing it together by hand. No pressure, just a clearer picture of what’s happening before you decide what to fix.
FAQ
What is a good conversion rate for a sales funnel?
A good conversion rate for a sales funnel depends entirely on funnel type and traffic source. WordStream’s benchmark data puts paid landing pages around 2.35% on average across industries, with top performers over 5% [1]. HubSpot’s benchmark reports show lead gen and local service funnels converting higher, often 5-10% [2]. Instead of chasing one universal number, check which category your funnel actually fits before judging your rate.
What causes a low conversion rate?
A low conversion rate is usually caused by one of five things: mismatched traffic, a weak landing page or offer, poor follow-up, weak lead qualification, or comparing against the wrong benchmark. Most solo marketers stop at the first likely cause they spot instead of confirming it with data. That often means fixing the wrong stage first.
How do I audit my marketing funnel?
You audit a marketing funnel by checking each stage in order: traffic quality, landing page and offer, follow-up, then lead qualification. You can repeat this process every quarter, but doing it by hand across Google Analytics 4, Hotjar, Unbounce, and your email platform takes hours you may not have. That’s why a faster diagnostic path is worth considering.
What is the average conversion rate by industry?
The average conversion rate by industry ranges from around 2-3% for ecommerce, 1-3% for B2B SaaS trial signups, 3-6% for lead gen forms, and 5-10% for local service inquiries, according to WordStream and HubSpot benchmark reports [1][2]. Company size and sales cycle length shift these numbers, so check your category before assuming you’re underperforming.
How long should it take to fix a broken funnel?
Diagnosing a broken funnel should take hours, not weeks, once you know which stage to check first. Fixing it traditionally takes about a week per stage, though AI-assisted rebuilds can compress that into a single-day sprint for landing pages and follow-up sequences.
What’s the difference between a landing page problem and a traffic problem?
A landing page problem shows up as high bounce and low opt-in rates on traffic you’ve already confirmed is qualified. A traffic problem shows up as poor engagement or low click-through rates on traffic that looks fine on the surface. Check with Google Analytics 4 and Hotjar together rather than guessing which one it is. Then verify your diagnosis with at least a few days of clean data before you spend effort fixing that stage.
Is my funnel conversion rate low because of traffic quality or funnel design?
Always check traffic quality first. It’s the most common mistake solo marketers make. If you fix your landing page before confirming the right audience is arriving, you’ll waste your effort on a stage that was never the real leak. A professional funnel diagnostic removes the guesswork from this order. If you want to talk through what you’re seeing before you commit to a fix, reaching out for an estimate costs you nothing but a few minutes.
Sources
[1] Conversion Rate Benchmarks for YOUR Industry (Exclusive Data!) | WordStream, https://www.wordstream.com/blog/conversion-rate-benchmarks [2] Marketing Funnel Audit Checklist [Free Access] | HubSpot, https://offers.hubspot.com/marketing-funnel-auditRecent Posts
Why Is My Funnel Converting Below Industry Average?
A below-average funnel conversion rate almost always comes from one of five causes: mismatched traffic, a weak landing page or offer, poor follow-up, weak lead qualification, or the wrong benchmark. You don’t need a week of guessing to find the cause. A structured funnel diagnostic can find it in hours. If you’d rather hand the work off, that’s exactly what
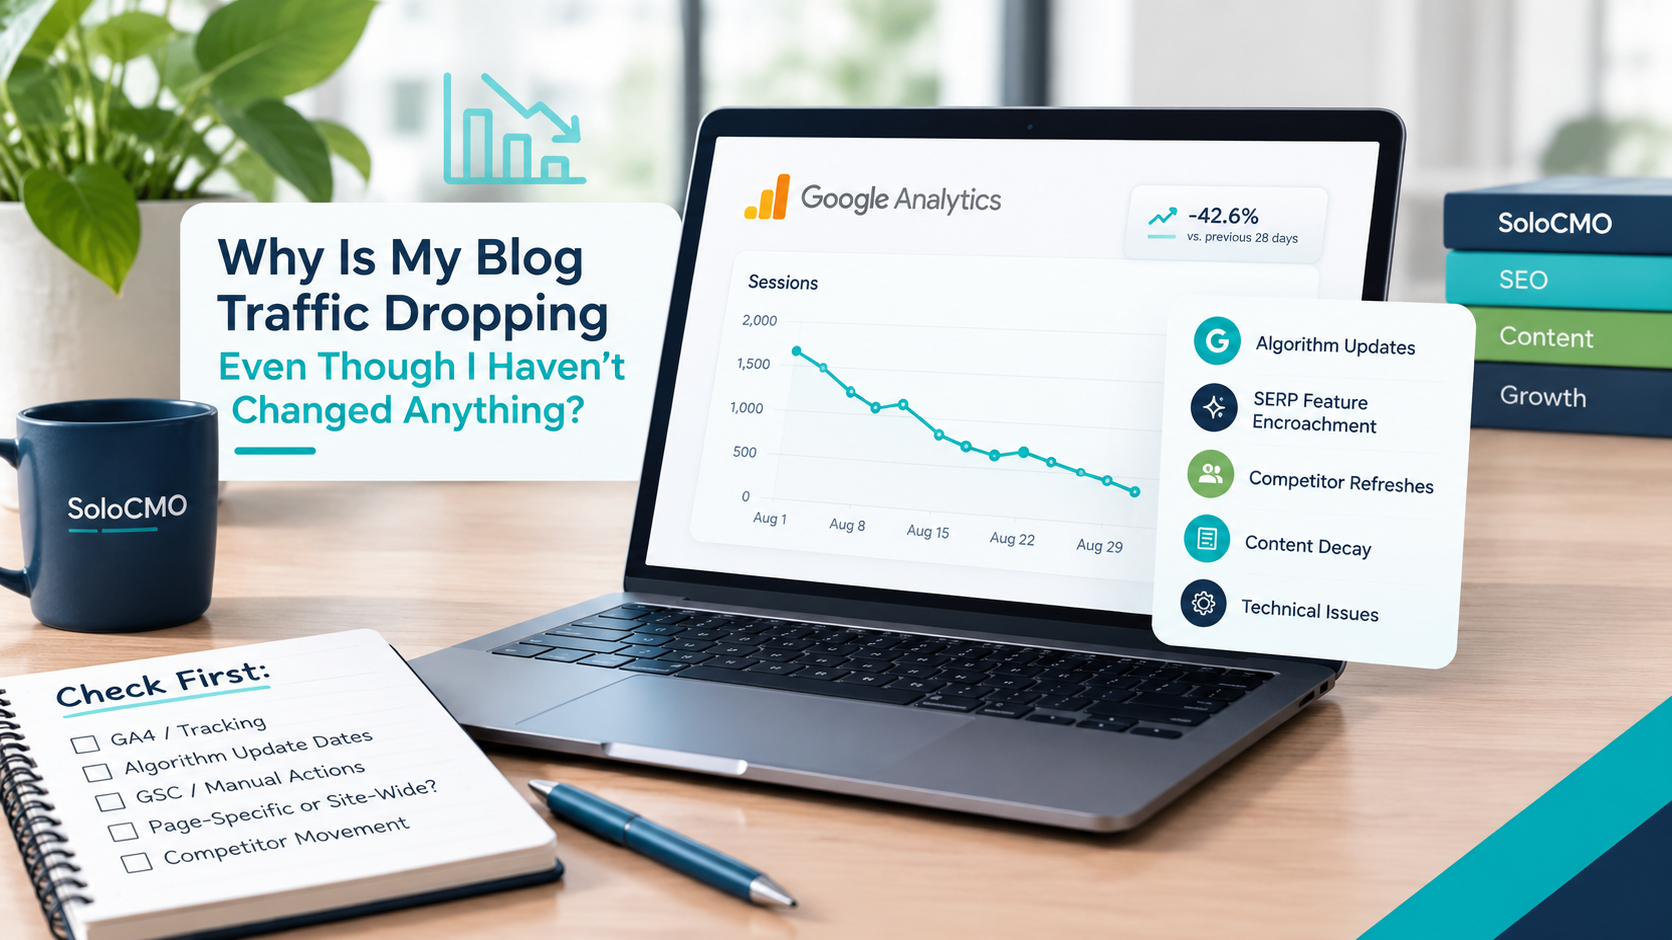
Why Is My Blog Traffic Dropping Even Though I Haven’t Changed Anything?
If you’re staring at a declining line in Google Analytics and mentally replaying every recent action looking for what you broke, stop. Blog traffic dropping for no reason is one of the most confusing problems a solo marketer can face. Here’s the short answer: it’s almost never something you did. Traffic drops without site changes are usually caused by algorithm
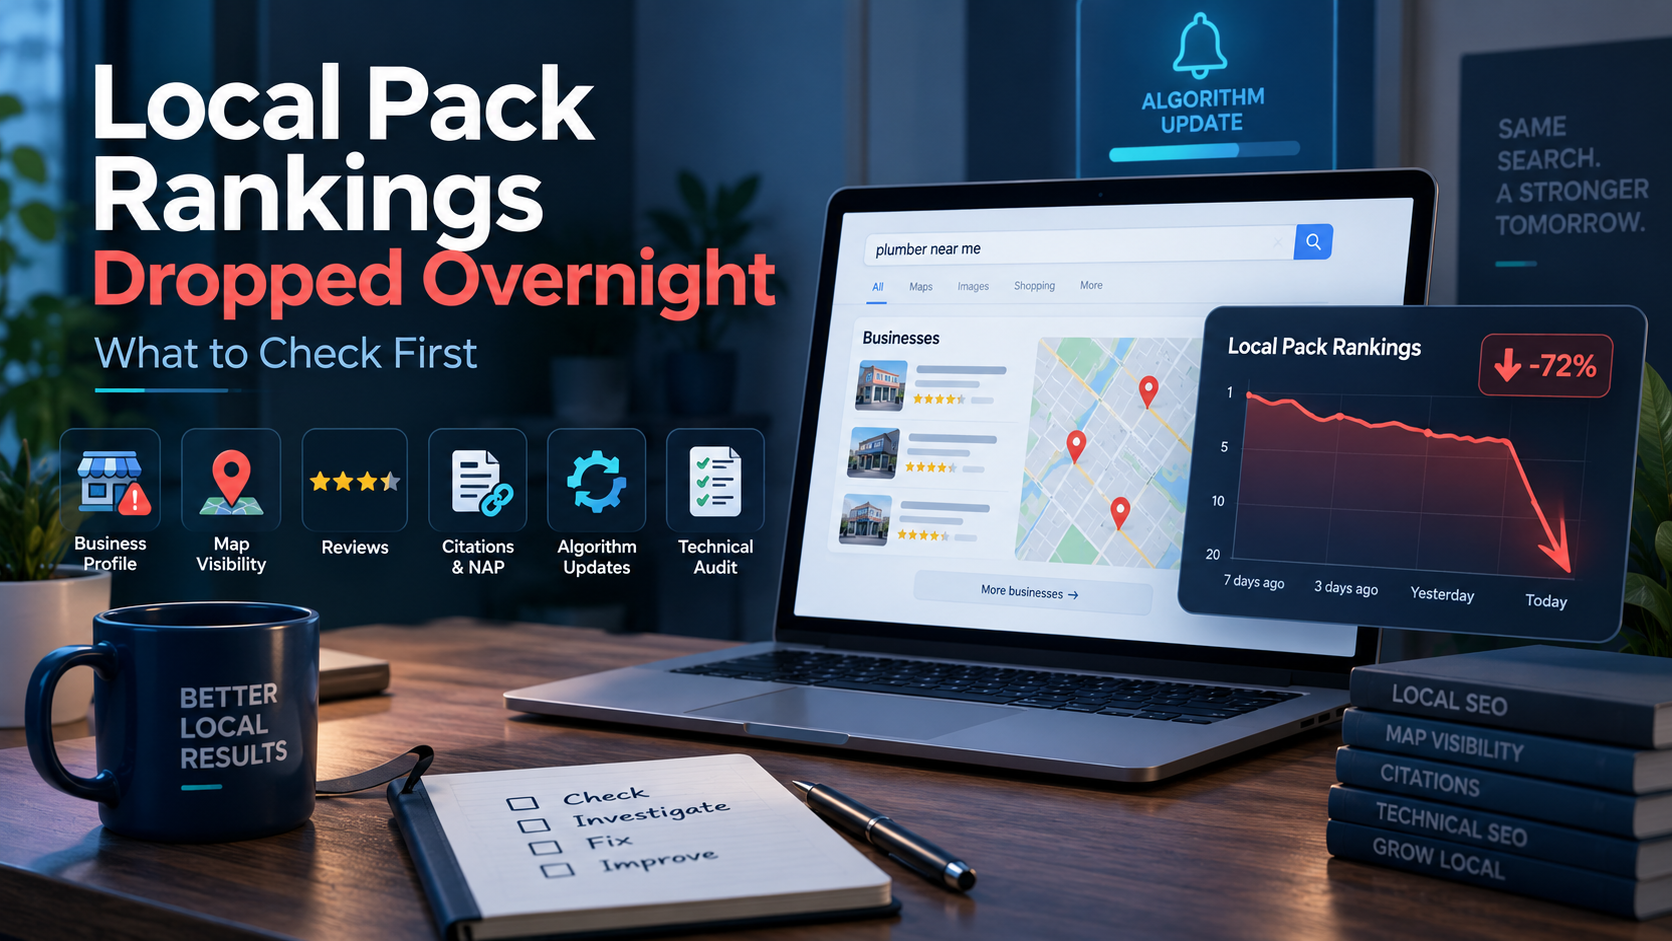
Local Pack Rankings Dropped Overnight: What to Check First
Okay, first thing: check your Google Business Profile status. When local pack rankings drop overnight, that’s the fastest and most common cause, and confirming it takes under two minutes. This isn’t a mystery that needs an agency or a week of guessing. It’s a known, ordered checklist, and you can run it yourself in the next hour. If your GBP
Get Smarter About Your Marketing
Practical SEO, AI, content, and marketing strategies you can put to work immediately.
Join the Newsletter